Error or Uncertainty from Graphs::
graphs·@abdulhanankhan·
0.000 HBDError or Uncertainty from Graphs::
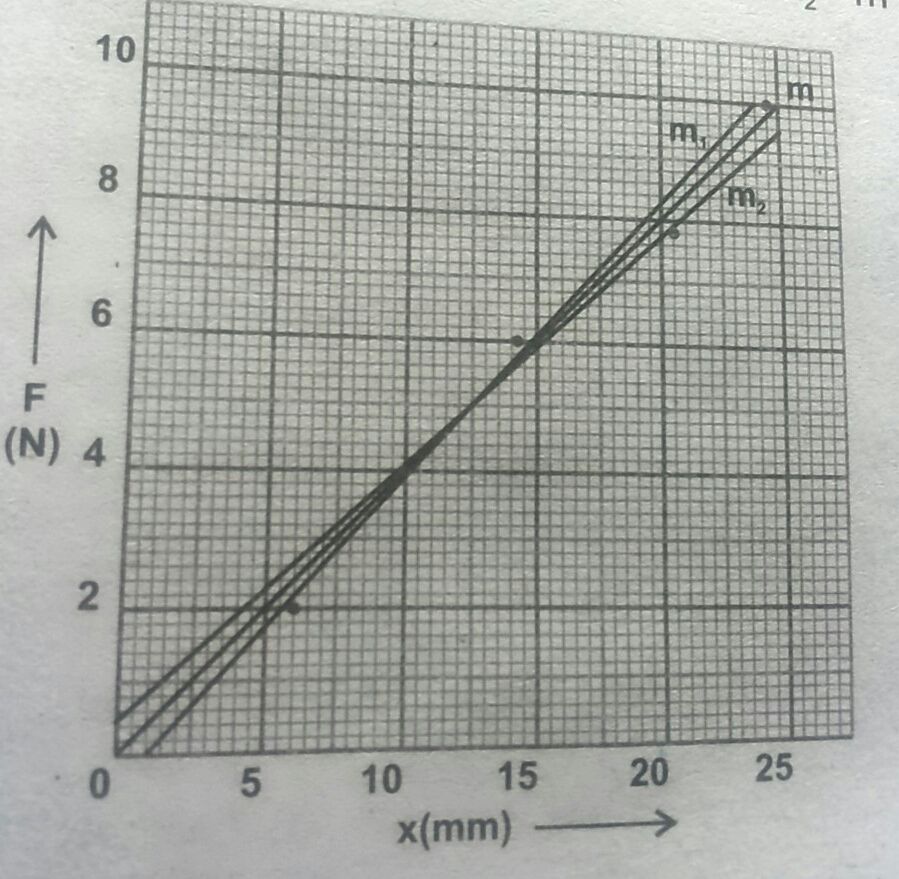 Method:: To find uncertainty in an average value obtained by plotting graphs, the first step is to draw best straight line through the plotted points using a transparent ruler. The best straight line passes through as many of plotted points as possible or which leaves almost an equal distribution of points on either side of the line. 3) The second step is to pivot a transparent ruler about the center of best straight line to draw greatest and least possible slope. If slope of best straight line is "m" and greatest and least slope are" m1" and "m2" as illustrated in above, Then evaluate m1 - m2 and m2 - m which ever of these is greater is the maximum possible uncertainty in the slope. If the intercept on a particular axis is required, the similar procedure can be followed. Thanks to read the Artical.