Managing Expectations when trading SBD for STEEM
steemit·@alexpmorris·
0.000 HBDManaging Expectations when trading SBD for STEEM
I've been meaning to post this for a few days now, but keep getting tied up with other projects and such. About a week ago, I had a series of back-and-forth comments with @valued-customer on my post from several months back, "<a href="https://steemit.com/trading/@alexpmorris/don-t-convert-sbd-to-steem-buy-it-on-the-steemit-market">DON'T CONVERT SBD to STEEM, BUY IT ON THE STEEMIT MARKET!"</a> Once again, I feel this interaction is worthy of meriting its own post. @valued-customer was upset *(and I don't blame him... unfortunately, he literally bought STEEM right before the big sell-off)* that after he bought STEEM with his SBD on the internal market, his account value **DECREASED** by $40 to $70! As such, he was asking for some insight as to what may have happened to account for this "unexpected result": >SBD was ~ $1.20 at the time, IIRC, so I thought I would increase my account value by ~ 20%, or so (Steemit valuing SBD @ $1, I thought). So, some part of my understanding was very, very wrong. Here was my first response: >@alexpmorris: The "Estimated Account Value" that you see displayed in your wallet is calculated as the 7 day average value of STEEM, which has been going down the past few days. > >However, on the internal market, the value of SBD (since they've been "printing" more of them, has been going down versus STEEM). On the internal market, it looks like from one of your trades, you sold 61.878 SBD to receive 34 STEEM, which is equivalent to a rate of 1.81 SBD / STEEM. > >Now, I don't think this is even reflected for you yet, but the price of STEEM also just tanked 20% on the internal market versus where you traded your SBD as well, which can be attributed to a bit of bad timing. That's also why if you are looking to convert and can afford to wait, it's usually worth holding out for "tanks" such as these to take place before making your exchange. Of course, one never knows for sure, and it can keep going up. But usually you'll get at least a short "panic" opportunity at some point to catch a better price... > https://steemitimages.com/DQmQrSHpGW8skYLNJzzhCNu1KiUmeWS9Yv3bPeccpmqnvzT/stmsbd-20170705-20pct-tank-15m.jpg He responded as follows: >@valued-customer: Thanks very much for your insight. SBD had been steadily decreasing in value, and I expected that sooner was better than later to make the transaction. Clearly I was shooting at a target I could not see. > >Where do you get that chart? Also, it is rather busy. None of the plots are labeled, so it is as opaque as my last (and first) trade was to my understanding. > >I expect you are correct about the price of Steem impacting my account value. The loss seemed to be entirely caused by my trade, and I do expect further account value decrease as a result of Steem losing value. It's true that some of the charts that I post may be a bit overwhelming for those less familiar with trading, and I do plan to post more on some of their features in the near future. However, my next response serves to better explain some of what is shown: >@alexpmorris: The chart is from my trading platform <a href="http://tymorapro.com">tymoraPRO tradeSCAN</a>. All the indicators I use (besides following the raw price action) tend to be related to identifying a volatility distribution on the move, and also help identify when prices reach extremes on a various time frames. > >This chart has lower band GMMAs (<a href="http://www.guppytraders.com/gup329.shtml">Guppy Multiple Moving Averages</a>), 5/8/34 ohlc XMAs (<a href="http://stockcharts.com/school/doku.php?id=chart_school:technical_indicators:moving_averages">Exponential Moving Averages</a>), VolSqueeze (combination of <a href="https://www.bigtrends.com/education/catching-big-trends-with-acceleration-bands/">acceleration bands</a> and <a href="http://www.investopedia.com/terms/b/bollingerbands.asp">bollinger bands</a>), <a href="http://www.investopedia.com/terms/v/vwap.asp">VWAP</a>, Volume/VolMA (<a href="https://www.scottrade.com/knowledge-center/investment-education/research-analysis/technical-analysis/the-indicators/volume-moving-average-vma.html">volume moving average</a>), VolTrails (volatility trails that track a sort of "pain point" for traders, sort of like a multi-timeframe version of <a href="https://seekingalpha.com/instablog/70713-marcjoli/1489861-daily-volatility-trading-strategy-using-chandelier-stops-on-xiv">Chandelier Stops</a>), and VolByPrice (<a href="http://stockcharts.com/school/doku.php?id=chart_school:technical_indicators:volume_by_price">volume by price</a> on the right). I could write several posts just on each of those! > >But that should be enough for now if you want to google around a bit. Also, once you've studied trading long enough, you start to quickly get an idea all the indicators being used. Having each one listed on a chart often just takes up extra space. Here's one though with a bit less going on! > https://steemitimages.com/DQmbyM7n9LkScYRkYEhFSQYVympxRaGnFvDtQR2cs68iDDi/stmsbd-20170706-25pct-tank-30m.jpg Of course, it was a bit busy on my first chart, so I do understand where he's coming from. The bigger point that I wanted to convey, however, was really to get down to the "price action". What that means is that you don't look at a chart as a bunch of bars or patterns, so much as for the "story" they tell you. When you see a monument in a park, it doesn't signify a stone or a person, so much as the "great battle" that took place there, or the tremendous courage exhibited by these individuals. The price action **creates** the chart patterns, **NOT** the other way around... https://www.youtube.com/watch?v=YeFiwYQtGp0 # For example, look at the wild volatility that expressed itself shortly before the price of STEEM started tanking about 10 days ago. Now think what was happening in those strange looking bars to cause them to appear this way, in this particular "combination" : <center> https://steemitimages.com/DQmXMTYhhjXGJkL2eEAXEztLkg9qmCJcw7NfNs2mfcWBwDS/stmsbd-20170706-25pct-tank-5m-high-volatility.jpg *(here is the wild volatility zone, zoomed in, basically there was very little price liquidity over a 10 cent range after a slow and steady, and heavily over-extended run-up in the price of STEEM/SBD)* </center> # https://steemitimages.com/DQmNLityRxztuKbSr5j9KZTdFVKD8zVmdhuRwR163RXawZM/stmsbd-20170706-25pct-tank-5m.jpg # What you see here are people buying high offers and low bids with not much going off in between, until "out of the blue" the price of STEEM tanks. Think of it as a bit of "hot potato". Finally people just gave up, or placed stops just below that range, and when it broke, everyone piles on all at once and chases it all the way down. # So, where do I BUY?! Now some might wonder where is the right place to consider going long again on STEEM? Well that's where some of these indicators come in. However, you must keep in mind the **FRACTAL NATURE OF MARKETS**! Meaning, with a move of this size and force, this is likely a large primary thrust down on a much larger time frame. What that means is that after a decent pullback, we're likely to see at least a secondary thrust lower to at best test the recent lows, and at worst, extend the first leg down in a symmetric fashion and then some... <center>https://steemitimages.com/DQmZseCVoivgQD4iU7sHcGjT3Fv4AQvbowq5LQhD48pjr3X/stmsbd-20170706-25pct-tank-5m-rebound-funny.jpg</center> # # So what's happened since then? Well, here's that massive symmetric second thrust leg down on a 60 minute chart, but not before the first leg retraced over 50%, and nearly hit the 61.8% retracement level before resuming its downtrend: 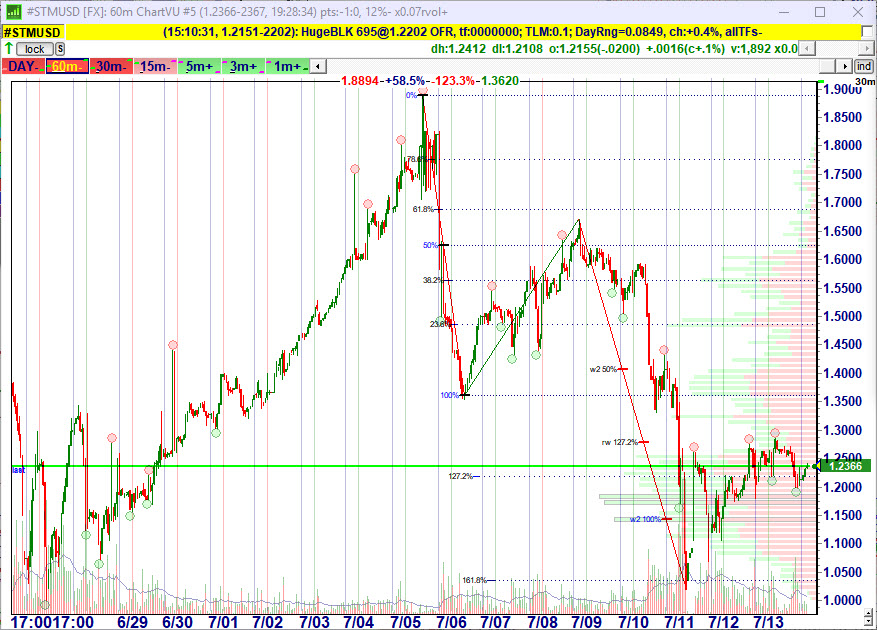 # If you're planning on holding most of your STEEM long-term because you're a big believer in the platform, you probably really shouldn't worry all that much about all these crazy volatile swings. However, you should still be okay with the "possibility" that things often don't quite play out as you hoped or expected they would. Think of it more as a long-term option play... it could go to zero, or it could be a huge home run. And from that perspective, if you feel it would seriously hurt you (ie. you can't pay your rent) if STEEM prices go down, then adjust your holdings accordingly, and at least consider taking some off the table after a huge run-up! That's why risk management and position size is so critical when trading and investing. Your level of "exposure" is one of the few things you *can* control in the markets (and in life). Of course, the other way this information can be helpful is, for example, if you've been busy accumulating SBDs at 50/50. Even better, let's say you converted a chunk of them to BitUSD or some other currency to lock in some of the recent premium, kudos to ya! :) You're now just waiting for an opportunity to increase your STEEM POWER holdings at better prices. You could do worse than just **waiting out** for the inevitable "dump" that always seems to come along, usually when you least expect it. And regarding STEEM POWER as a potential long-term investment, besides the obvious ROI "dividends" you receive by posting and curating, I will make this one small point. With <a href="https://www.google.com/finance?q=NASDAQ:FB">FaceBook valued at over $450 BILLION</a>, and <a href="http://adventuresincapitalism.com/post/2017/07/09/SNAPageddon.aspx">SNAP valued at over $25 BILLION, despite consistently losing more money each quarter</a>, it doesn't seem all that far-fetched that STEEM's valuation could eventually reach and sustain *at least* some small fraction of that. And correct me if I'm wrong, but I'm also pretty sure that STEEMIT is cash flow positive for pretty much everyone involved! # FINALLY... I wanted to note that with SBD trading below $1 USD again, due to all the additional SBD that's been issued recently *(in an attempt to "rebalance" the system)*, you may also want to consider powering up a few posts again. Of course, if you still think STEEM will edge a bit lower near term (or you'd like to pull out some bucks for other purposes), stick with 50/50, as you can always exchange it for STEEM on the internal market later on. For more details on this, check @contentjunkie recent post, "<a href="https://steemit.com/steem/@contentjunkie/steem-backed-dollars-are-below-usd1-again-it-now-makes-sense-to-do-100-power-up-posts-and-sbd-to-steem-conversions">Steem Backed Dollars are Below $1 Again - It Now Makes Sense to Do 100% Power Up Posts and SBD to STEEM Conversions</a>". Hope y'all found this post somewhat helpful and insightful, and ***STEEM ON***, my Friends! :) <center>*As always, I appreciate your upvote, your follow and all your comments!*</center>
👍 alexpmorris, fuzzyvest, officialfuzzy, suprepachyderm, ihashfury, jason, bue-witness, bue, mini, healthcare, alphacore, boy, bunny, daniel.pan, moon, helen.tan, craigslist, fitnessquest, yuslindwi, steemornot, awpmaster, felixq, studiohyperion, bluehorseshoe, michellectv, livingfree, domo, runridefly, iliketoast, jkly87, sv67216721, theywillkillyou, digitalplayer, world5list, apolymask, x-files, samstonehill, mahdi313, treecubed, eni198881, black-eye, ariane, shawnfishbit, piratrob, qadrisafriza, jorgeshaulim, arcaneinfo, sofijs, trafalgar, ezo12, sephiroth, minnowsupport, banjo, venuspcs, elyaque, stephen.king989, heretickitten, ebargains, jhermanbeans, worldtraveler, gre3n, fisteganos, pomperipossa, xtrodinarypilot, fronttowardenemy, numpypython, choogirl, marcusxman, gindor, abcdoctor, goldgoatsnguns, qwasert, taica, cryptohustler, n1kofi, tech-trends, morodiene, dineroconopcion, cloh76, diana.catherine, raymondspeaks, tjtrusty, starrkravenmaf, decebal2dac, lastminuteman, ogochukwu, sn0n, singa, arjane, outerground, jhagi.bhai, yummymummy, whatamidoing, iulianbutanu, kenchung, natra, rycharde, mrwanderlust, burnedpixel, myday, flaminghedge, violetmed, glex, freetissues, d-pend, pharesim, fyrstikken, schauhan0896, yukimaru, mincery, procyon21, krazy, adraaz, lawrenceho84, benniebanana, kylek717, anya21, dksart, scaredycatguide, lurkingtrader, gregory-f, princepalsingh, goldenlucas, twigg, nettybot, gutzofter, hedge-x, v4vapid, etcbits, daxed, fancy-shmancy, houman, saryan, headliner, kenistyles, happyphoenix, lindahas, jakemore, outhori5ed, patelincho, sheeshkababage, lokii, angusleung100, richintel, postlegend, crypto-trail, stealthtrader, ampm, pacificzoolander, perrybtcgroup, tasslehoof, correctdrop, daio, davidalexander, mateolopez, kid4life, hackbot, pandaya, shredz7,