GDAX trading platform dashboard explained !! Coinbase trading platform
bitcoin·@alihbadr·
0.000 HBDGDAX trading platform dashboard explained !! Coinbase trading platform
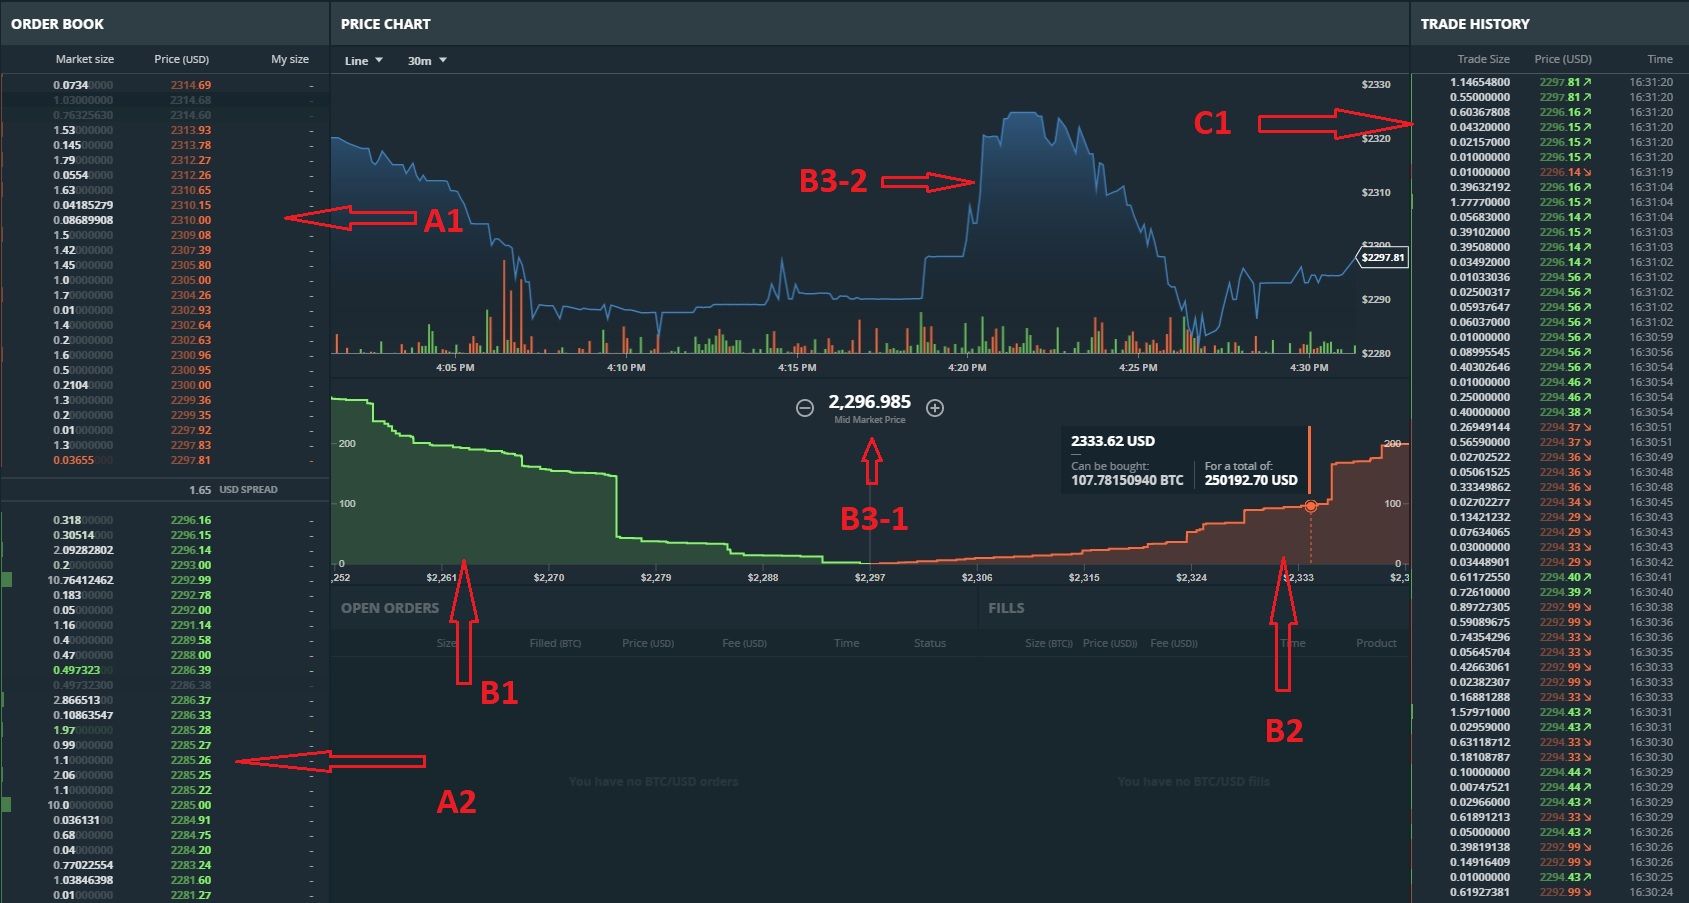 Match the Label from the screenshot to the explanation -- From Left to Right: A1: Shows you sell orders that includes the BTC amount as well as the rate (sell price) A2: Shows you the buy orders that include BTC amount as well as the (buy price) In between A1 and A2, there is USD ask-bid spread, which is pretty much the ((offer – bid)/(offer))x100 B1: Shows a graphical representation of the BUY order price with its respective Volume Notice in the how there are a lot of people willing to buy bitcoin at a lower rate, likewise in B2 more people are willing to sell at a higher rate. -- B3-1: This Mid Market price represents the price at which the buyer and seller agree on and a transaction takes place at that price. B3-2: Just shows the price as is C1: This shows a list of all the transactions that actually took place. Pretty much a history of B3-1 (Mid-market Price) https://www.gdax.com/trade/BTC-USD