XMR/BTC price analysis for the past 60 hours (01/10/2018)
cryptocurrency·@aotearoa·
0.000 HBDXMR/BTC price analysis for the past 60 hours (01/10/2018)
Hello guys, good morning! Let`s make a quick analysis on the XMR/BTC for the past 60 hours... XMR/BTC chart analysis (60 past hours). Just like my yesterday`s post on ETH/BTC techincal analysis, this pair has also shown quite an evaluation in the past 60 hours (as shown below) 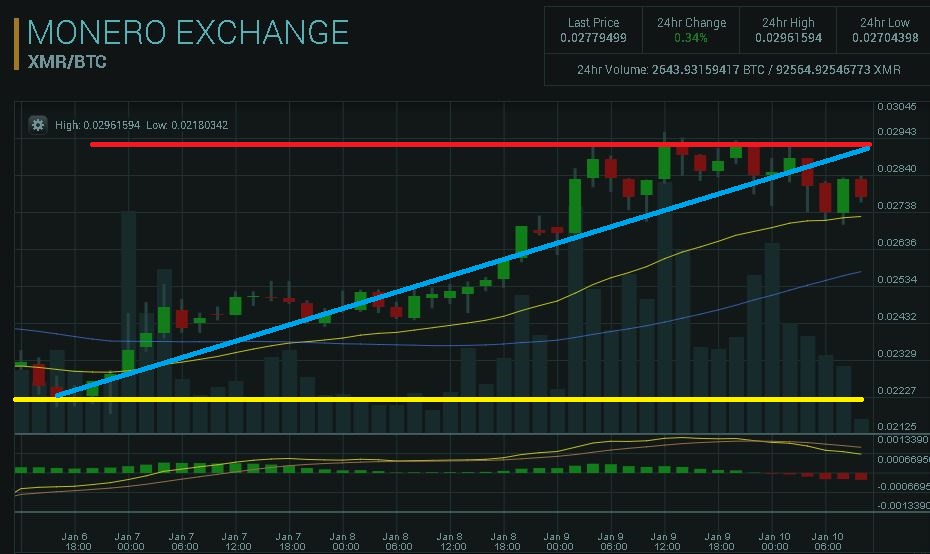 As you can see, there was an average gain of an average daily 10% in the past 60 hours. There has been un upward trend (so far), and thus, I intend to buy some more ETH soon!!! Below you might find the support and resistance areas for the last 60 hours period 0.02221428 support on 01/06 (shown in yellow) 0.02929600 resistance on 01/09 (shown in light red) *Trend is being shown in the blue line As you can see on the 4 day graph XMR/BTC`s trend is an evaluation one (since the coin has already evaluated 31.8792% in less than 3 days, with no signals of a market dumping. This might occur, due to XMR`s intrinsic properties (anonimity, large trading volumes (reflected by community`s good acceptance of the coin) and a good (and increasing marketcap (currently on $6.140.205.022 USD or 0.01% of the global marketcap)) increase on each token`s value (currently on $393.97). 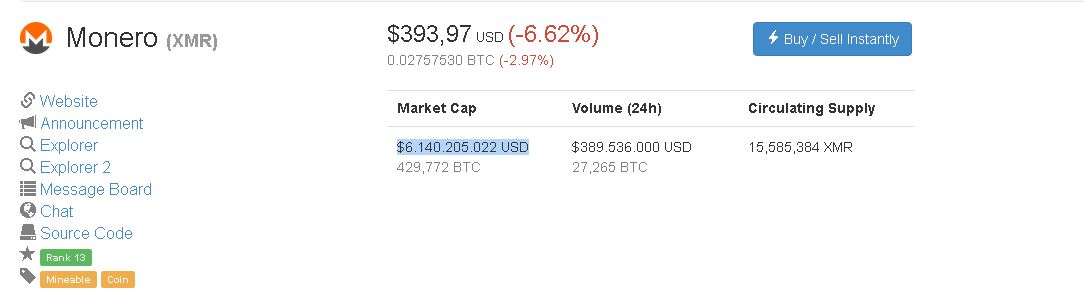 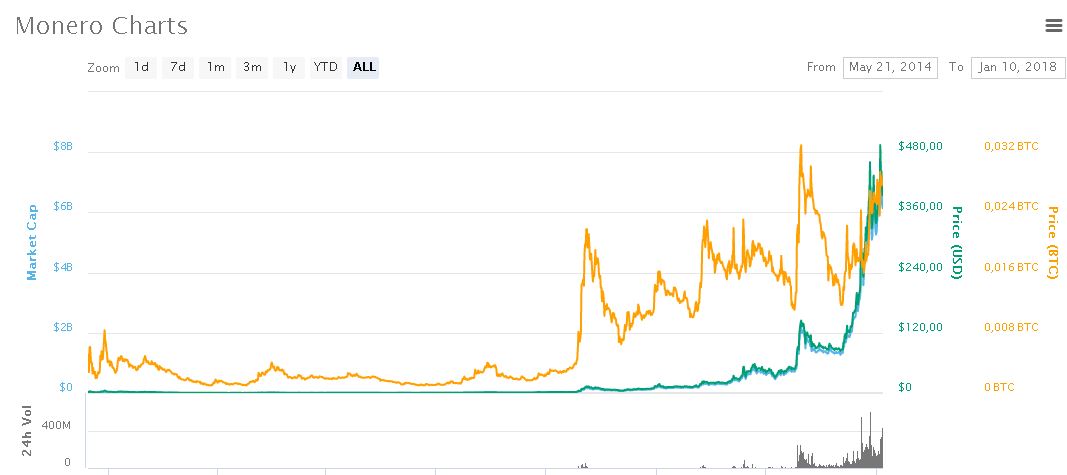 Also when we compare the XMR/BTC pair in a mid-term period (7 days), we can also see that we have a very clear evaluation trend since its last dump (that took place on 01/05th) 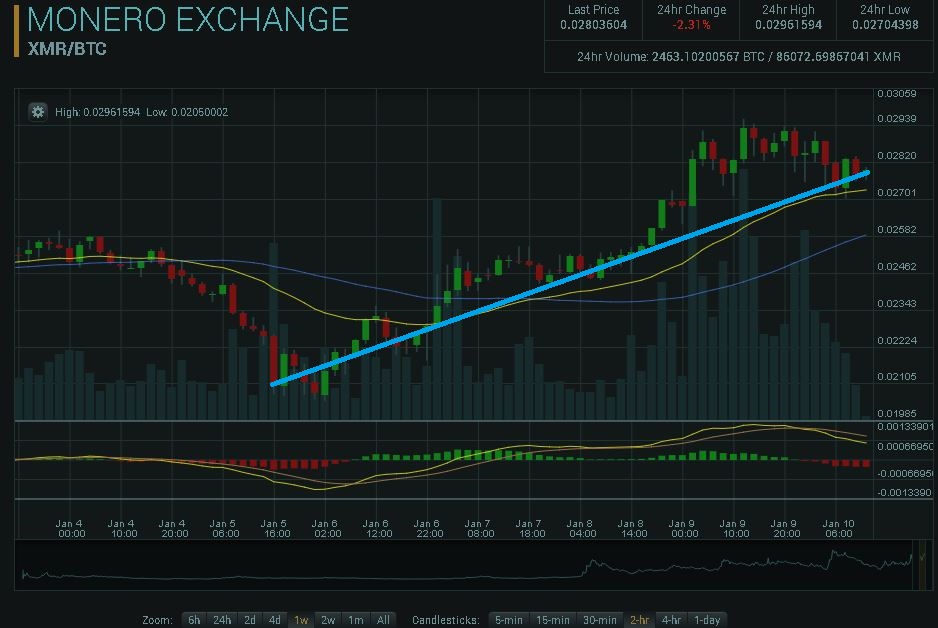 If this coin keeps this uptrend, I reckon that a correction might occur in another 4 days (that`s only my prediction). If this happens to be true, then the correction pice on this pair should be around 0.03887499. PS This is only a prediction and it shouldn`t be considered as an advice to buy or sell. Use your own dilligence in order to operate in the market. Please let me know your thoughts, and if you agree (or not) with those predictions. My other cryptocurrencies market technical analysis https://steemit.com/cryptocurrency/@aotearoa/eth-btc-48-hour-price-chart-analysis If you like this content, please upvote my posts and resteem it to help me with new daily contents