🚀 Splinter-lands Tool Update – Castles, Players, and Self-Sufficiency!
hive-13323·@beaker007·
0.000 HBD🚀 Splinter-lands Tool Update – Castles, Players, and Self-Sufficiency!
https://images.hive.blog/0x0/https://files.peakd.com/file/peakd-hive/beaker007/23uFPdKf8W8ZX71NBX84EzrbuDWKc44PmSAcGwNRzkmS25BuzUm5ySwCMfrXsDdoAMTYK.png
Hey everyone! I just pushed out a brand-new version of the Splinterlands land tool, and I’m super hyped to share what’s new.
You can try it out right here:
👉 https://splinter-lands.streamlit.app/
This update includes three major features:
* 🏰 Castle and Keep Overview
* 👤 Player Overview
* ⚖️ Updated Self-Sufficiency Calculation
These were all on my to-do list for a while, and while the Player Overview took a bit longer than expected (frontend struggles 😅), I’m really happy with how everything came together. Let’s break it down.
# <div class="phishy">🏰 Castle and Keep Overview</div>
Ever wondered which castles and keeps are collecting the highest taxes? Same here. I wanted a better way to visualize which castles look great on paper—but might not actually be earning much because there’s not enough active production around them.
With the new view, you can now:
* Compare castles/keeps side-by-side across regions
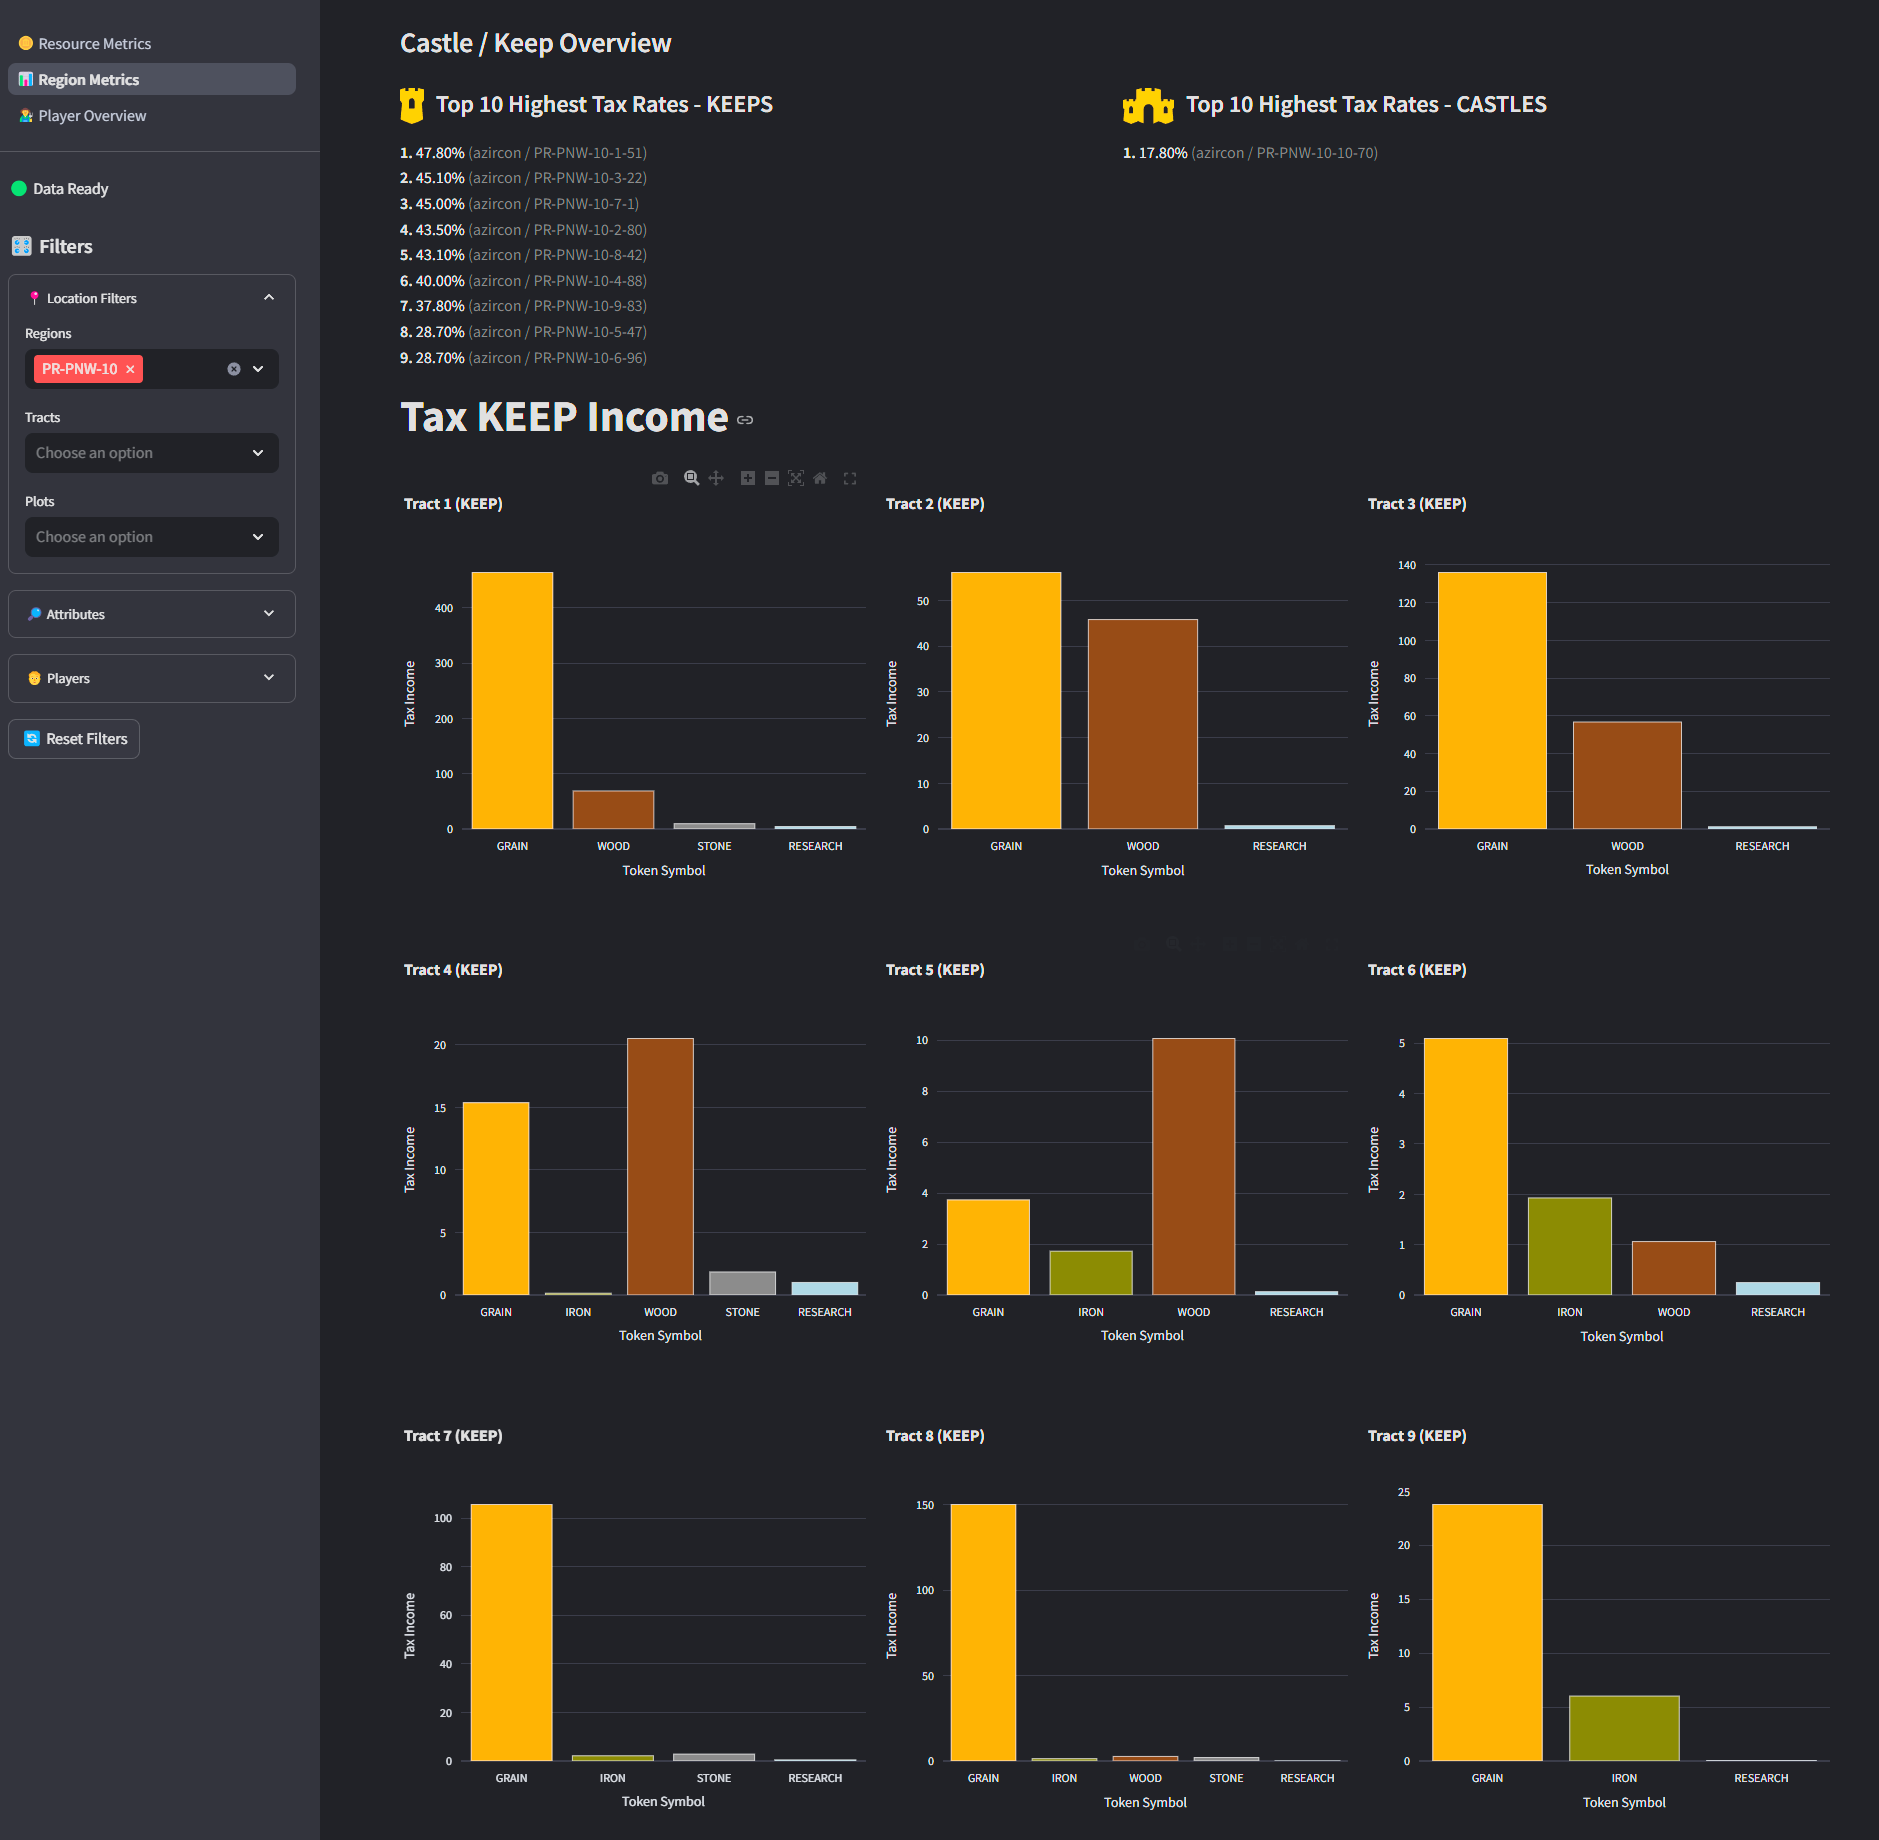
* Zoom in on a single region to break it down tract by tract
* Filter by your favorite region or tract
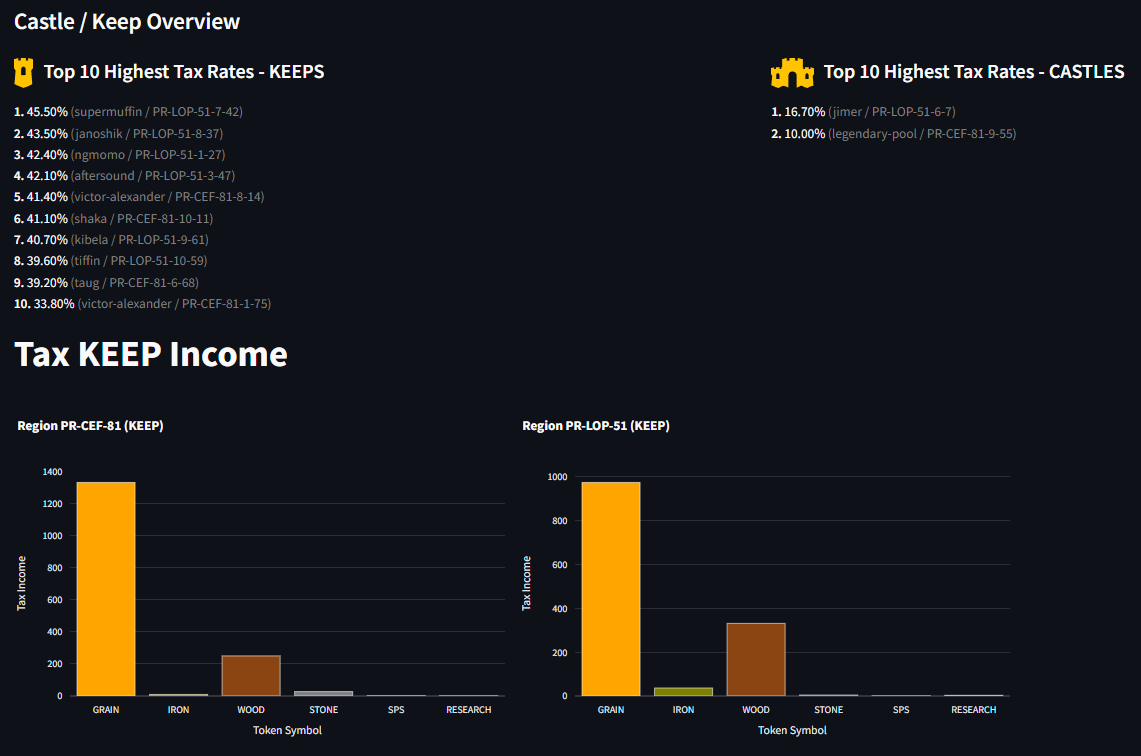
Note you can zoom in with drag and drop (double click is reset), this is for all graphs on the site btw
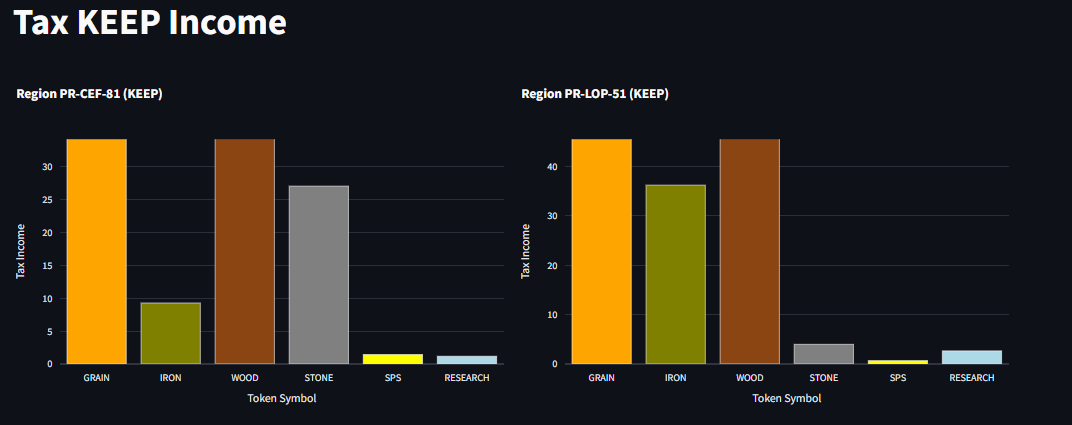
If you select only one region all Keeps will be shown side by side
Notice that tact 10 is missing that is because there you can find the castle:
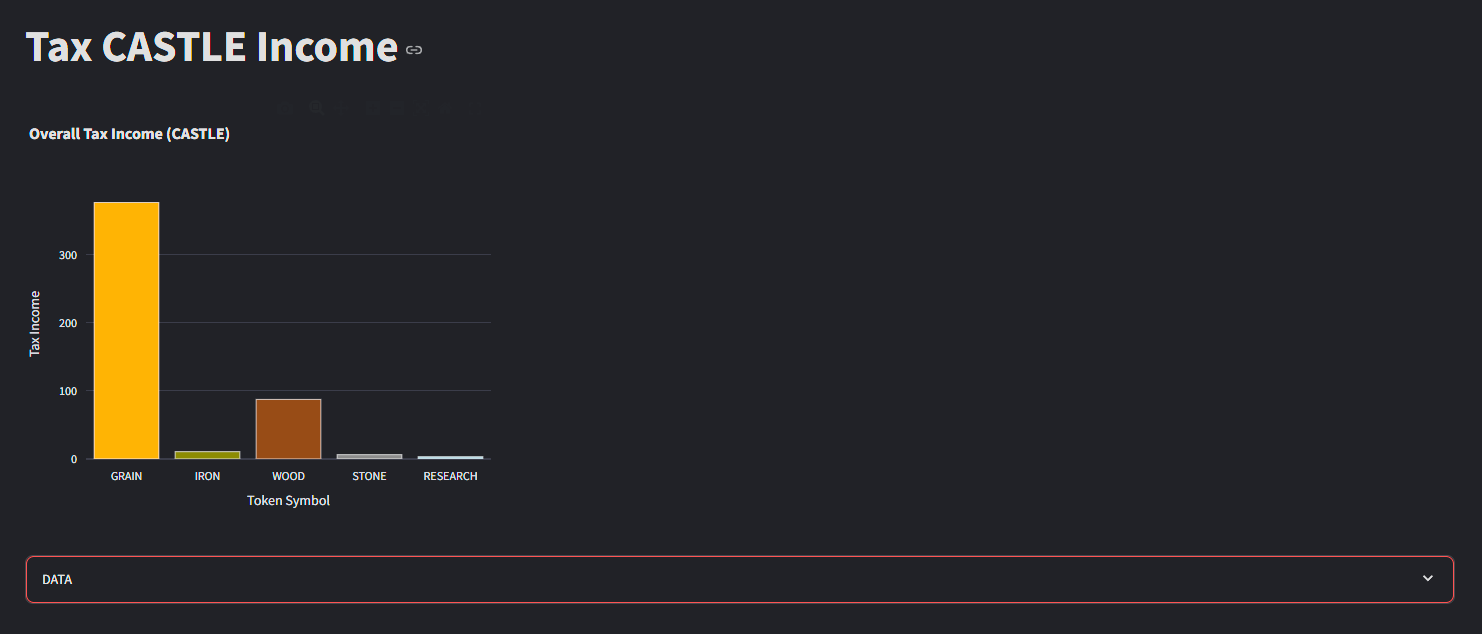
It’s not perfect yet, but it’s a great start and should make the tax meta a lot more transparent.
# <div class="phishy">👤 Player Overview</div>
This one is probably my favorite—and definitely the one that ate the most dev time. I always loved the view in the BaronsToolbox, unfortunately not maintained, so I built my own version of it!
Enter an account name and you’ll see how their plots are set up, including:
* Land types and buildings
* Bonusses
* Staked cards
* Construction status
* Production details
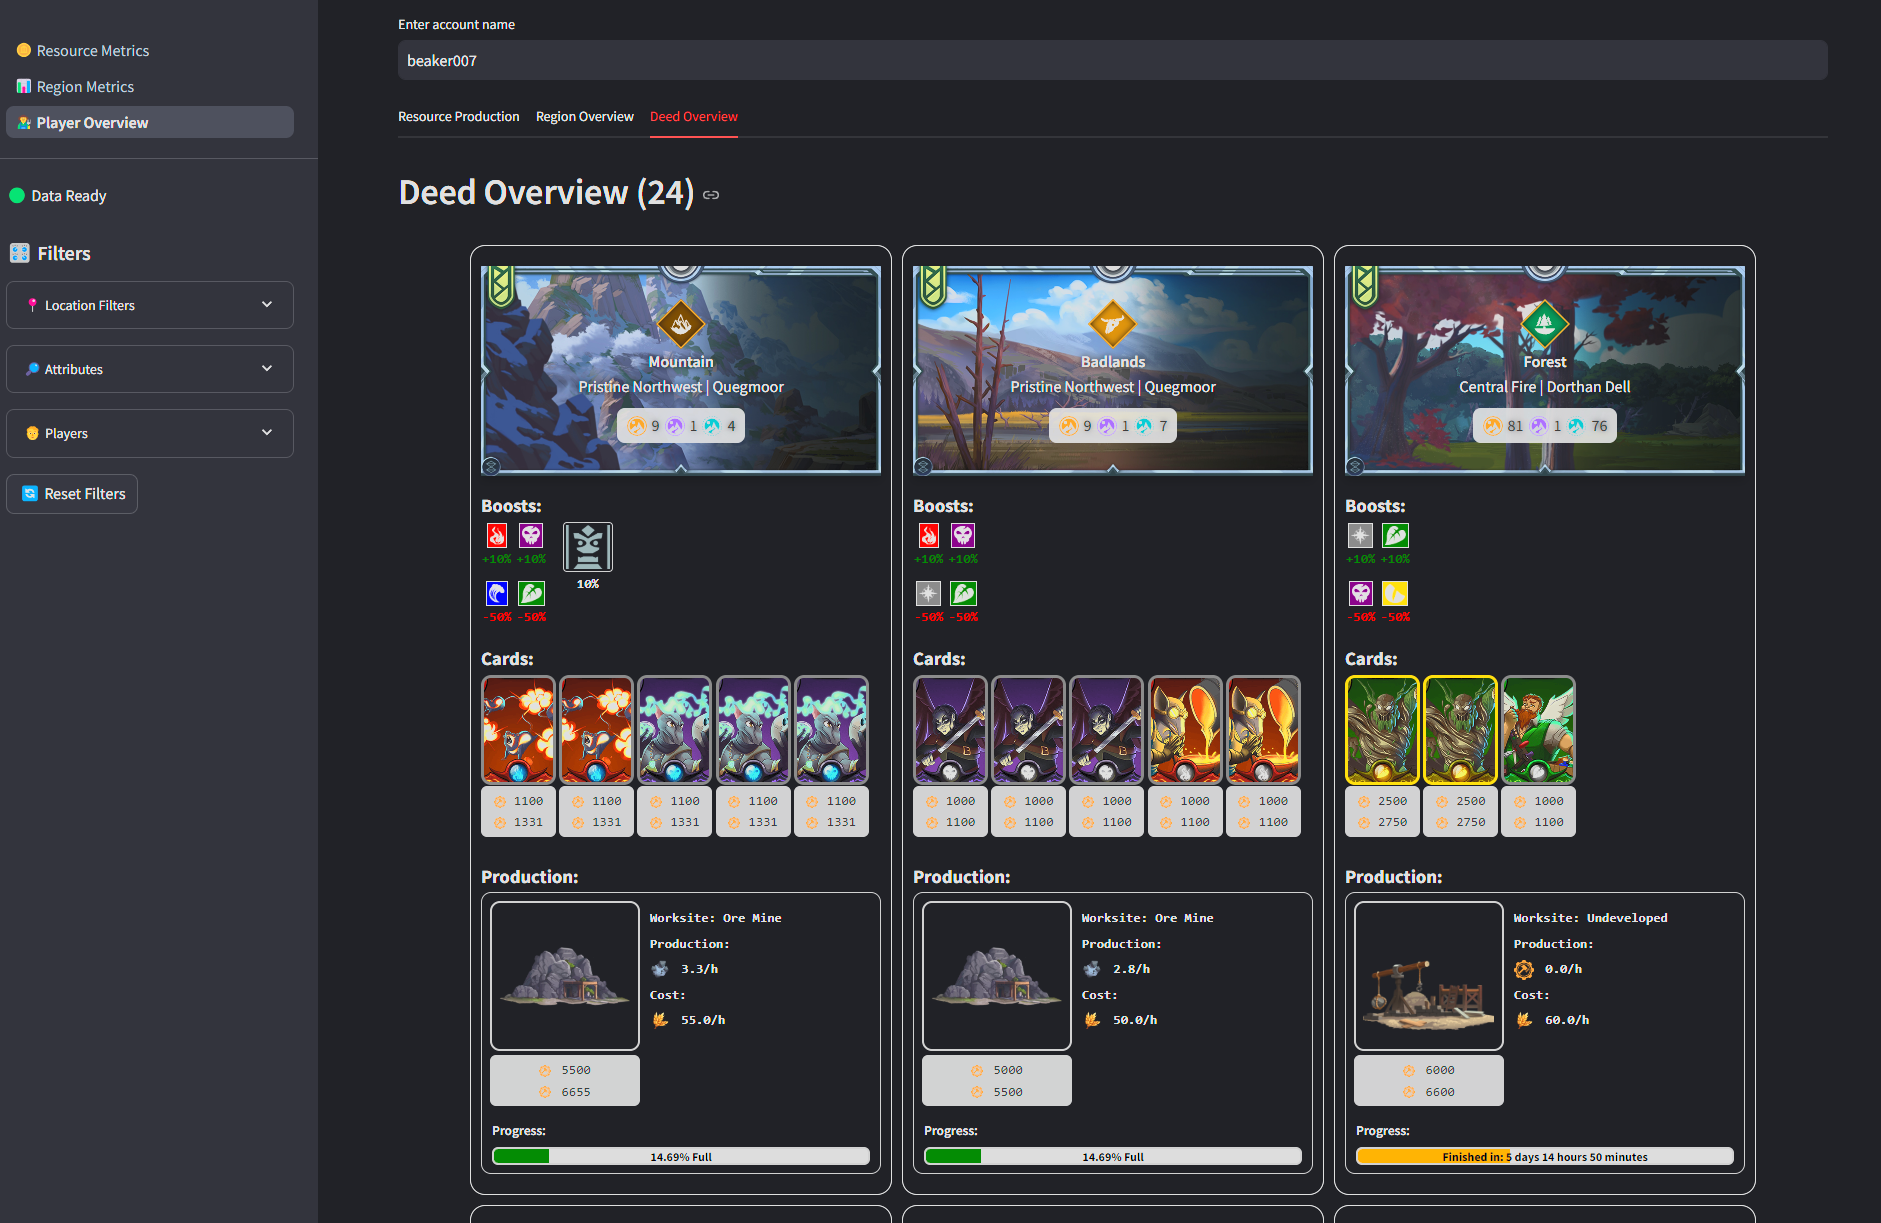
You can also filter to show stuff like only plots that are under construction, all with one click.
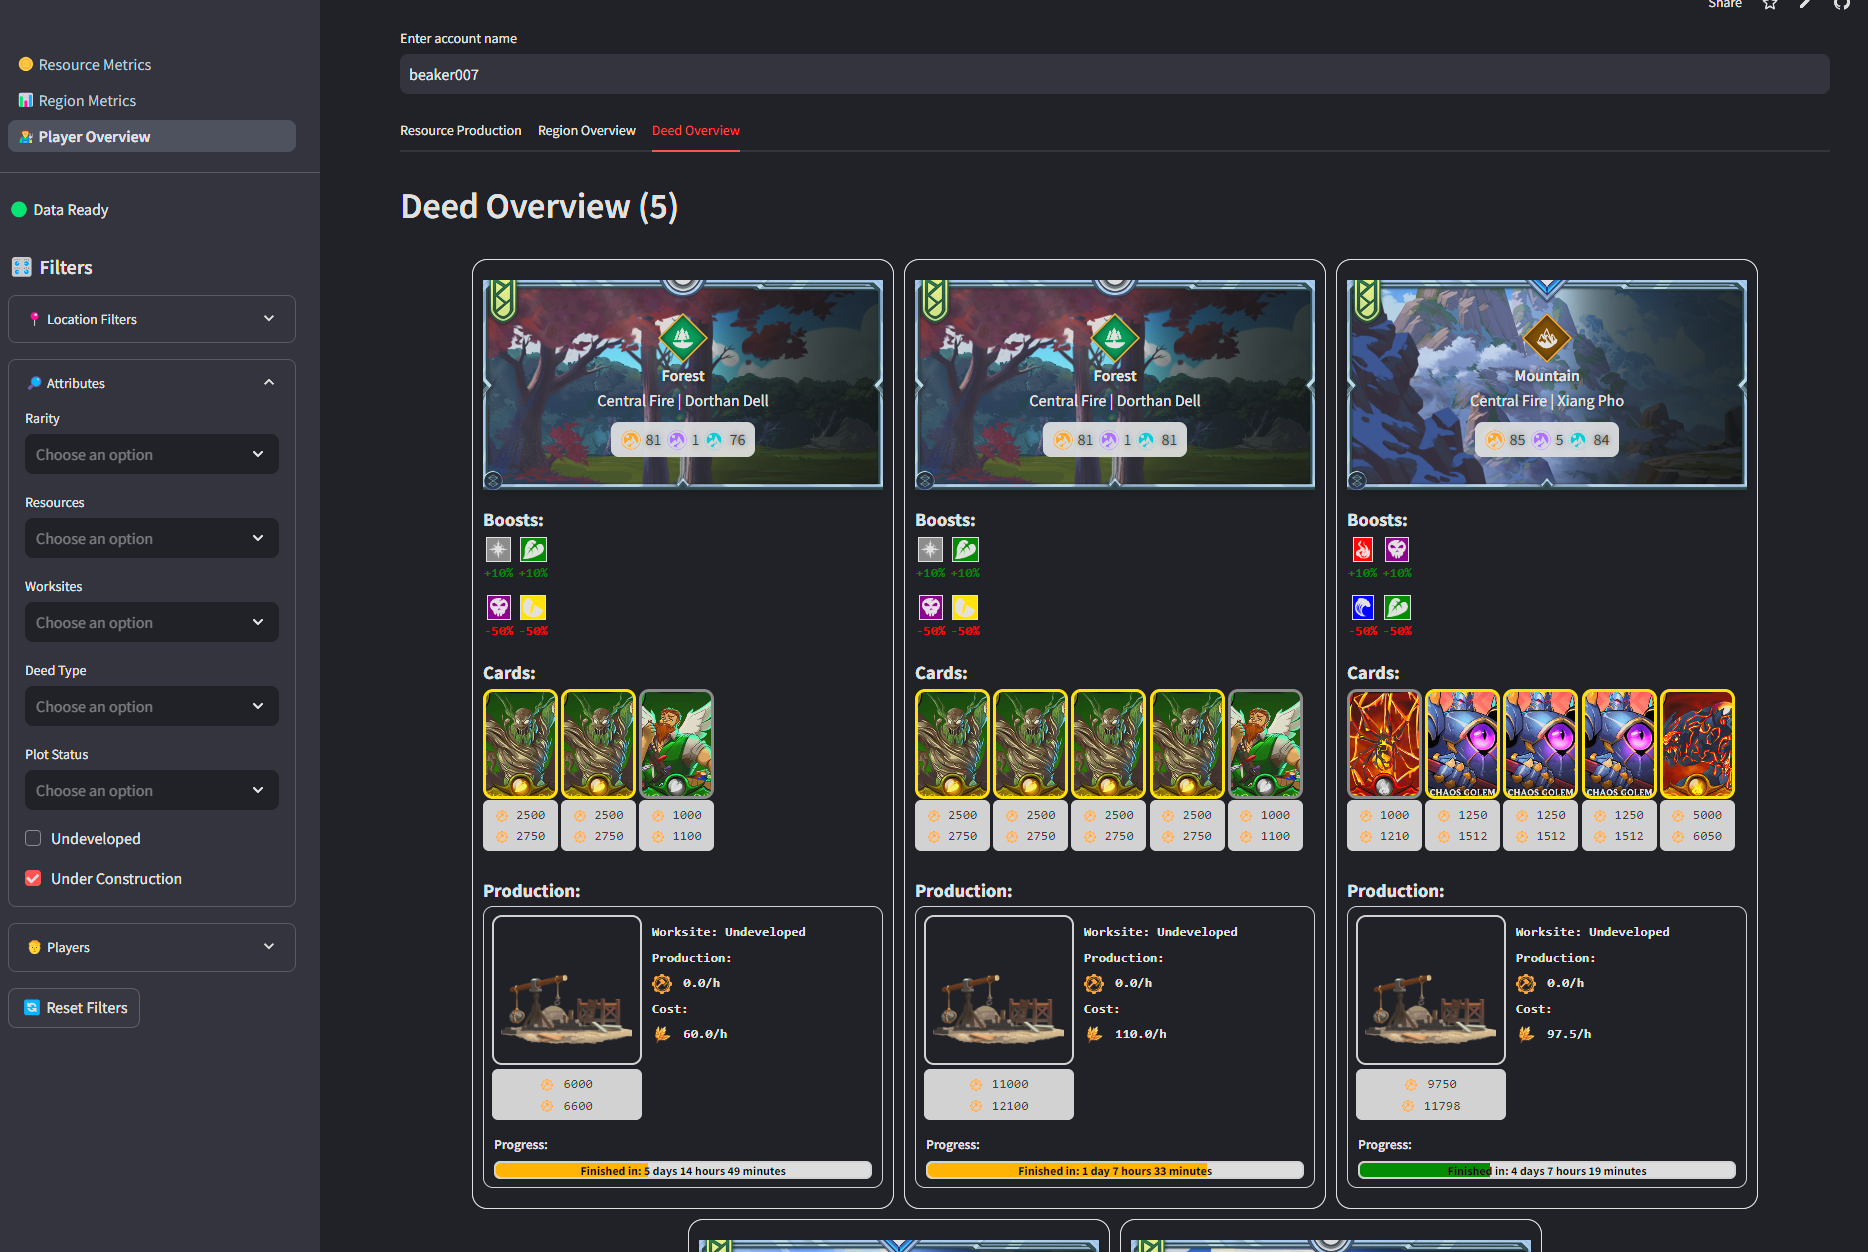
I'm more into data than frontend work (can’t lie 😅), but I think it came out pretty decent. Let me know if anything looks off or breaks!
# <div class="phishy">⚖️ Self-Sufficiency: Now a Little More Honest</div>
The self-sufficiency score got a bit of a rework. I noticed the old version was being a bit too kind to players who were in the red on resources. So here’s the new logic:
```
net_vals = list(dec_net.values())
net_sum = sum(net_vals)
total_activity = sum(abs(v) for v in net_vals)
if net_sum >= 0:
self_sufficiency_score = 100
elif total_activity == 0:
self_sufficiency_score = 0 # Edge case: all zeros
else:
imbalance_ratio = abs(net_sum) / total_activity
self_sufficiency_score = max(0, 100 - imbalance_ratio * 100)
color = "green" if self_sufficiency_score > 80 else "orange" if self_sufficiency_score > 50 else "red"
```
## <div class="phishy">🧮 So what’s actually going on?</div>
Let’s break it down:
* `net_vals` = the net DEC value per resource (positive or negative)
* `net_sum` = the total sum across all resources
* `total_activity` = the sum of the absolute values (total movement, regardless of direction)
* `imbalance_ratio` = how far off you are from balance, based on total activity
This gives you a ratio that captures how skewed your production is. If you're producing a lot and only slightly negative, you’ll still score fairly well. But if you're deeply negative, the score tanks accordingly.
For example:
* If you produce total 1000 and total only -100, you’re mostly good → score stays high.
* If you're at total production 50 and -40 on cost, the imbalance is much larger relative to your activity → score drops harder.
We then subtract that ratio from 100 and clamp it to make sure it doesn’t go negative. The result is a score from 0 to 100, with a simple color badge:
* ✅ Green = Good (>80)
* 🟧 Orange = Okay-ish (>50)
* 🔴 Red = Oof (<50)
>💡 Nerd Challenge!
If you're into math or data science and have a better idea for how to calculate self-sufficiency based on multiple values (some positive, some negative), I’d love to hear it! Maybe there's a cleaner or more statistically solid way to handle this. Let me know your thoughts in the comments or drop an issue on GitHub!
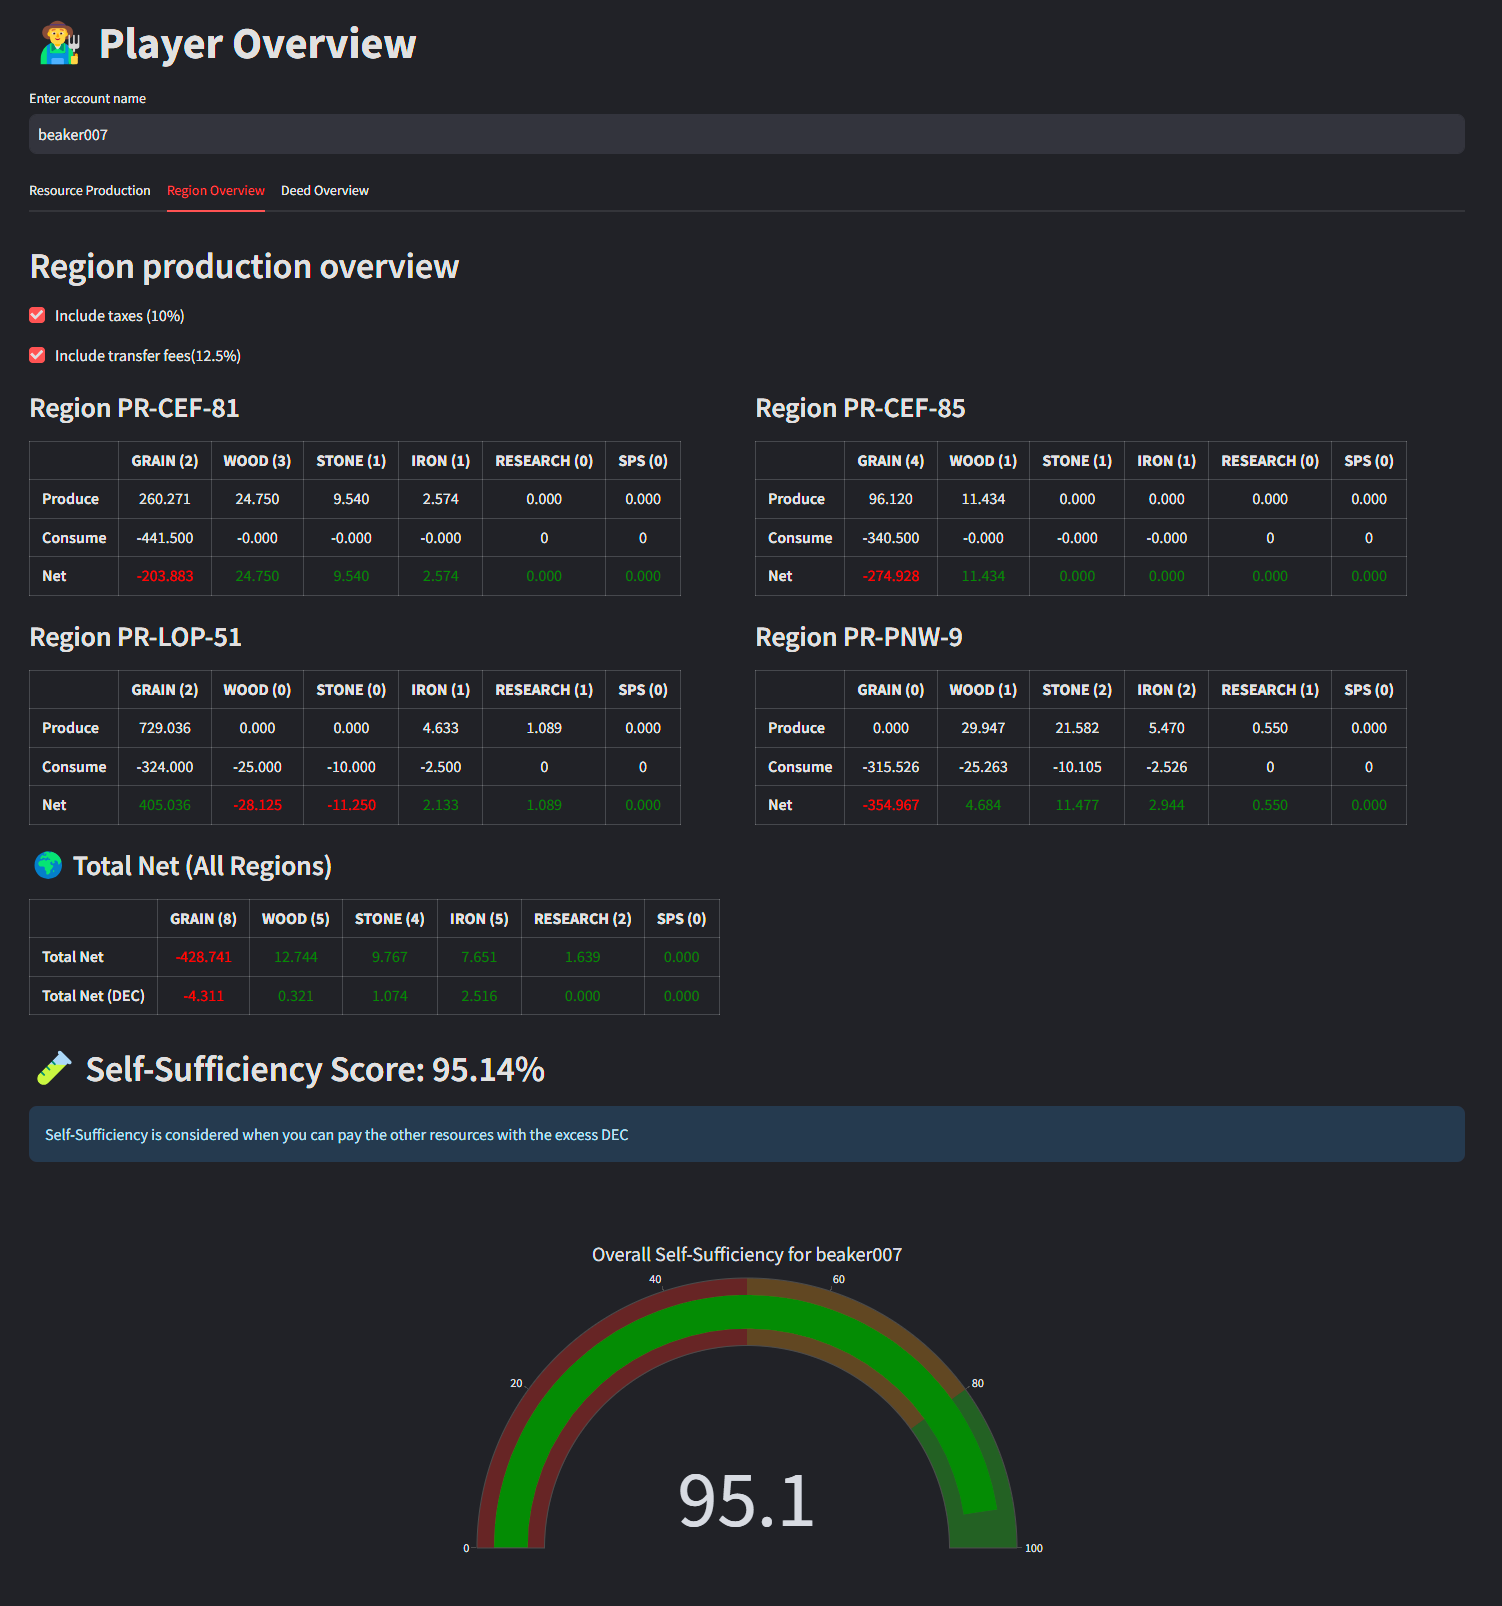
Note to take into account the taxes and potential transfer fees they can really make the difference.
Small extra in this overview i added the number of worksite you have for each resource between the ()
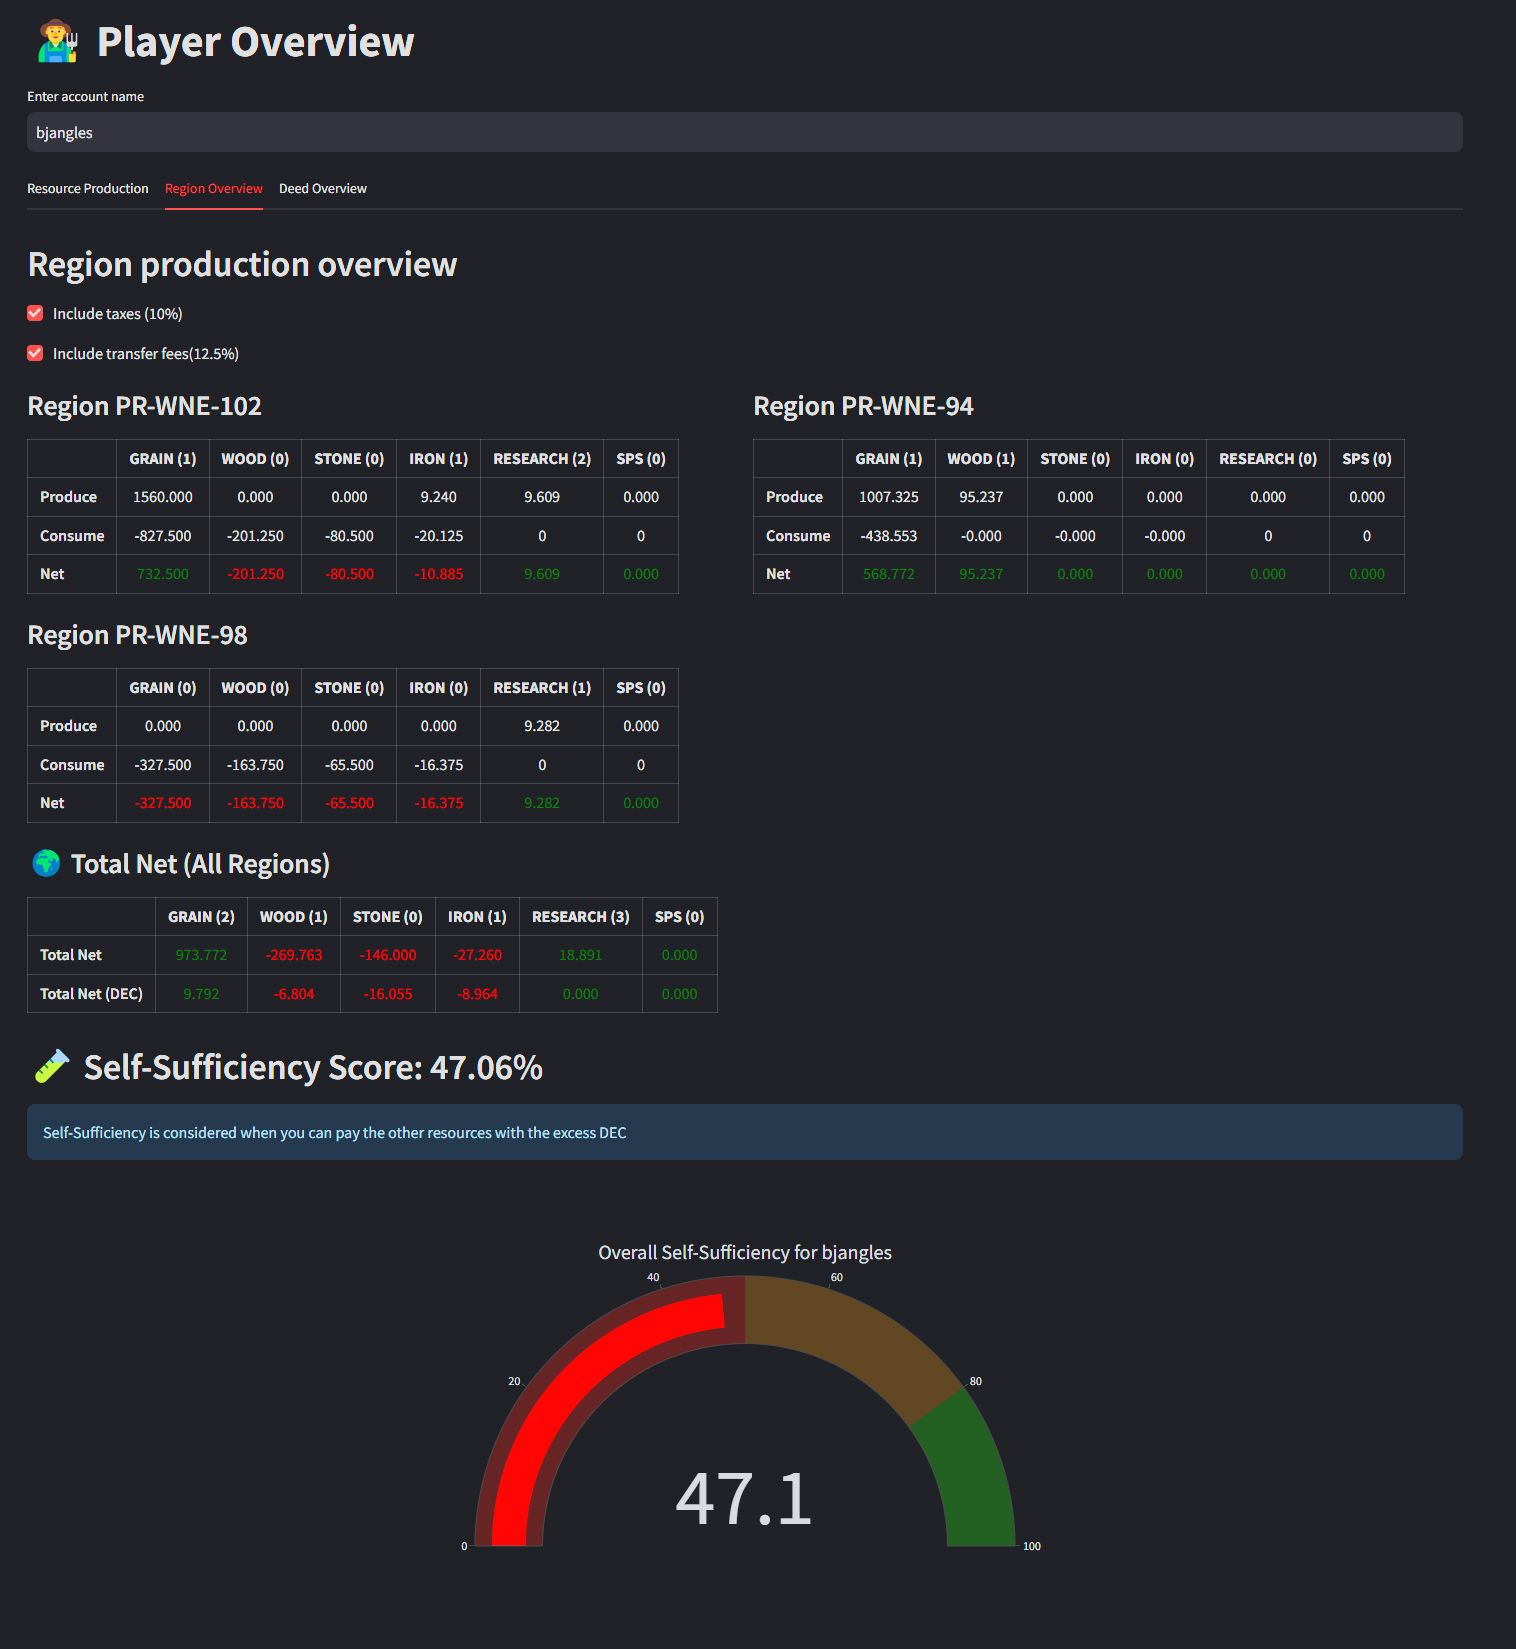
Sorry @bjangles —you got called out with a deficit there 😅
# <div class="phishy">🎁 Small Bonus: Sidebar Shuffle</div>
For those paying close attention—you might’ve noticed a small UI tweak: the filter bar has moved from the right side to the left sidebar.
https://files.peakd.com/file/peakd-hive/beaker007/23t792zuG2DPcEnXF6V6peXEL83EarnAV5j8DKCeLxYu88DXyuyny2Y6TEc87WWpsGudd.png
This change was mainly to help with the mobile experience. On smaller screens, it was getting a bit cramped with the filters floating awkwardly on the right. The sidebar approach makes it more consistent and accessible.
That said... I still prefer using the tool on a PC. With all the charts, graphs, and data flying around, the desktop experience just feels way smoother and easier to navigate. But hey—now it’s at least more usable on your phone if you want to sneak in a quick land scan while you're away from the keyboard. 😄
# <div class="phishy">🔧 A Quick Note on the Project</div>
Just as a reminder: this is a hobby project built in my spare time on free services (Streamlit + Supabase), so it might hit some usage limits from time to time. If that happens, I’ll explore other hosting options. Until then i try to have it running for free 😍
And yes, it’s still actively being developed, so bugs and improvements are part of the ride.
# <div class="phishy">💡 Got Ideas? Spot a Bug?</div>
This tool is open source, and I’d love for it to grow with help from the community.
📂 GitHub repo:
https://github.com/gamerbeaker007/splinter-lands
If you have ideas, feedback, or see something funky—just drop a comment and I’ll check it out. Let’s make this tool even better together!
That’s it for now! Hope you enjoy the updates, and I’ll see you all on the battlefield! 🧙♂️⚔️
https://d36mxiodymuqjm.cloudfront.net/website/splinterlands_logo.png
Do you also want to be part of this amazing play to earn game consider using my [referral](https://splinterlands.com?ref=beaker007) link.
👍 limka, playagame, splinterboost, terraboost, reazuliqbal, carl05, crypt0gnome, glimpsytips.dex, kryptogeier, monstermarket, apoloo1, nicolimitless, im-ridd, clifth, cur8, zangano, pastzam, zammie, lalupita, pandaparker, name0, nordics, cedricguillas, stoodmonsters, mimi.ruby, stoodkev, pastrane, aequi, fredaig, blackalas, ifhy, picazzy005, cocaaladioxine, kakakk, hoffmeister84, nozem01, terracore, menny.trx, sirsmokesalot96, portugalcoin, theycallmedre, pataty69, helgapn, munhenhos, laurasoares, emeraldtiger, sapphireleopard, tatylayla, teamvn, joaoprobst, bolachasmonster, jeremiahcustis, martusamak, thejedo, txracer, doombot75, nexus08, babybeaver, tarabh, arc7icwolf, learn2code, gadrian, imbartley, seattlea, monster-hunter, olympicdragon, libertycrypto27, sygxwin, elcristiano, gregory-f, squirrelacus, bjangles, kisifer, aleister, azircon, steemmonsters, reseller, yabapmatt, drillith, postpromoter, hadley4, bscrypto, sima369, athunderstruck, monstermother, elclements, gurseerat, gerjer, gannibal, goldmonsters, coolmonsters, splinterfangirl, sps.dao, dirego1, malnavi, djrockx, kalkulus, rakhmen, ghostlybg, pero82, holdeck2, priyabariya, techno.spt, njker, cubapl, jeffqt, ph1102.spt, davidtron, mercurial9, mochilub, argentium, jpleron, dreamryder007, greengineer, monster-mountain, louis88, renovatio, garute, fieryfootprints, holykikyo, captaindingus, kesonaichi, bpcvoter4, hurtlocker, happyskull,