Bitcoin 2013 versus 2018.... A story of two Bubbles
bitcoin·@bencrypto·
0.000 HBDBitcoin 2013 versus 2018.... A story of two Bubbles
Bitcoin in late 2017 burned up the charts in a parabolic rise. It seemed without precedent and was the immediate darling of the media with calls for a $50k usd Bitcoin. Now that the opposite has occurred and Bitcoin has corrected over 70%. The future of Bitcoin is hanging in the balance, discussed around the world everyday by thirsty traders, hopeful anacarchists and tech celebrities alike. What are the answers? What is the future of this seemingly unprecedented event? Simple Technical Chart Analysis on Bitcoin would have revealed that the huge pump was not without precedent. Enter 2013: A very similar parabolic rise and correction. Examine the similarities of the two charts. Bitcoin 2013 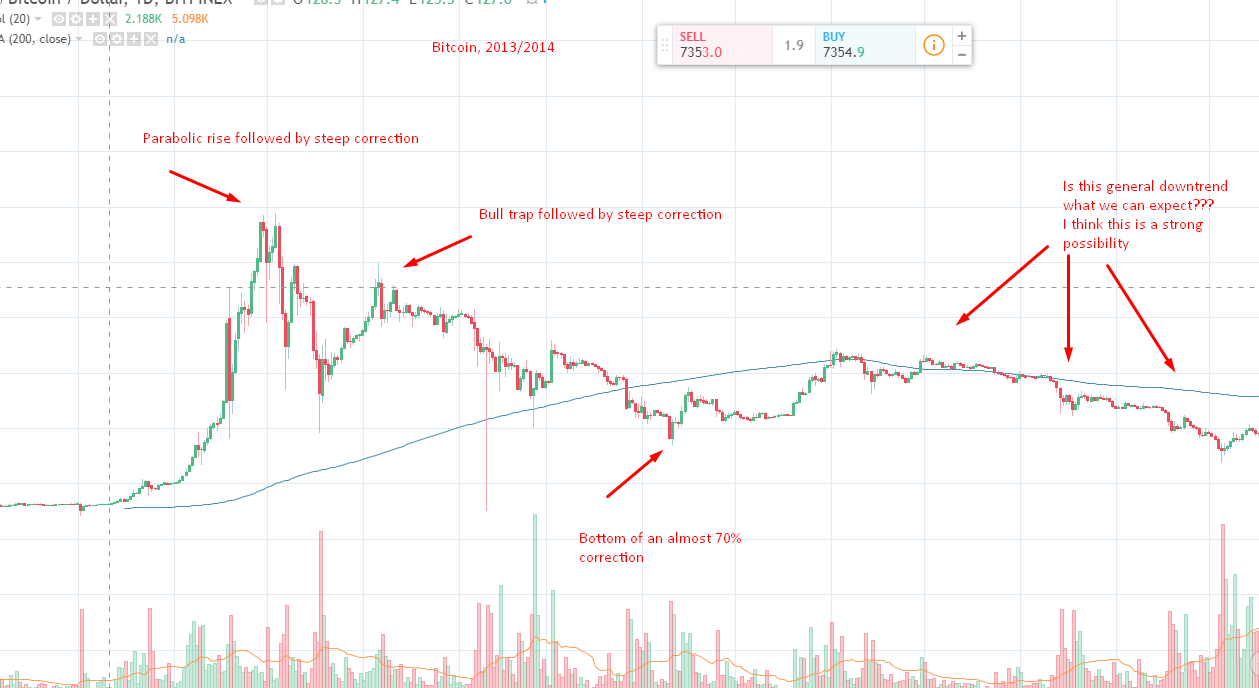 Looks very very much like Bitcoin 2018 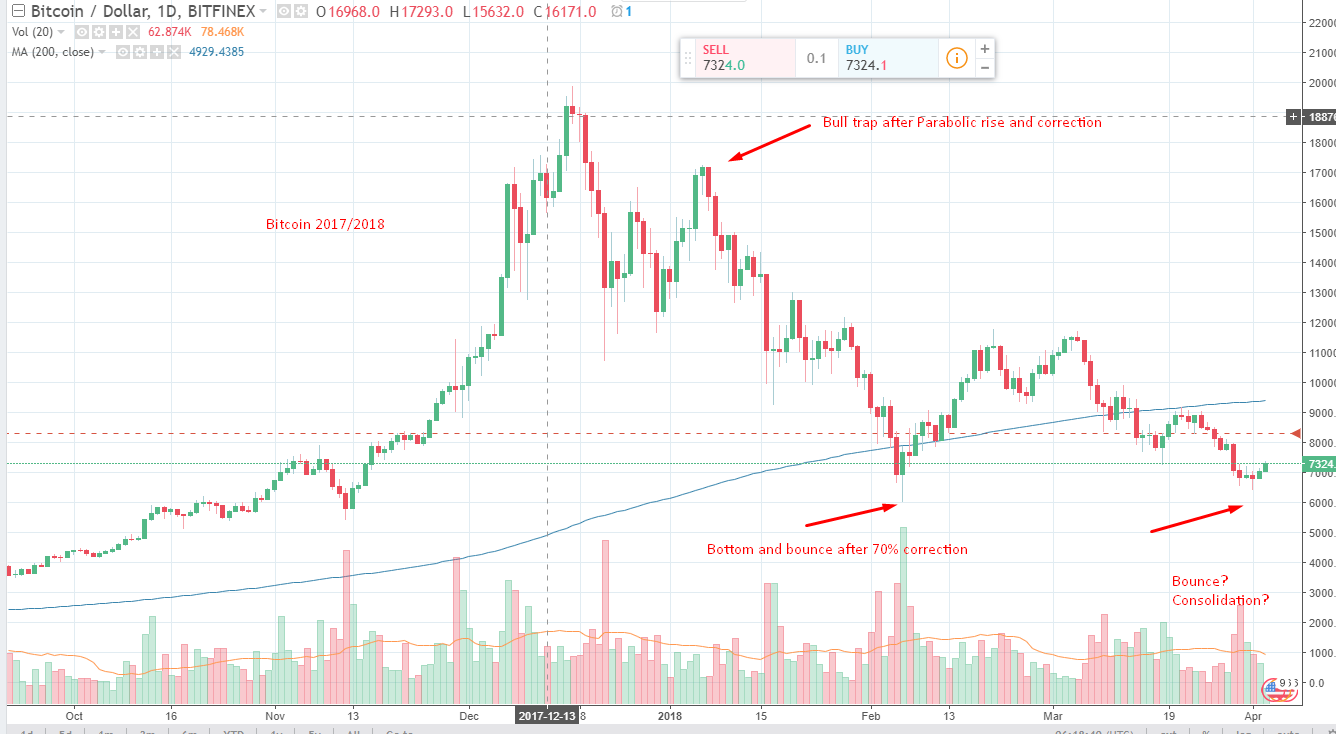 I expect a long period of accumulation, general downtrend and a long period of consolidation. Then, in true bitcoin fashion, a parabolic rise to new heights. This is meant for entertainment and informative purposes. I'm not a financial advisor and this isn't financial advise.