Amazon Daily Chart
charts·@bertoiarl·
0.000 HBDAmazon Daily Chart
Daily chart pattern suggests some pullback risk for Amazon with a potential head and shoulder topping pattern. A break below the neckline would mean a retest of the 50 dma at $1129.74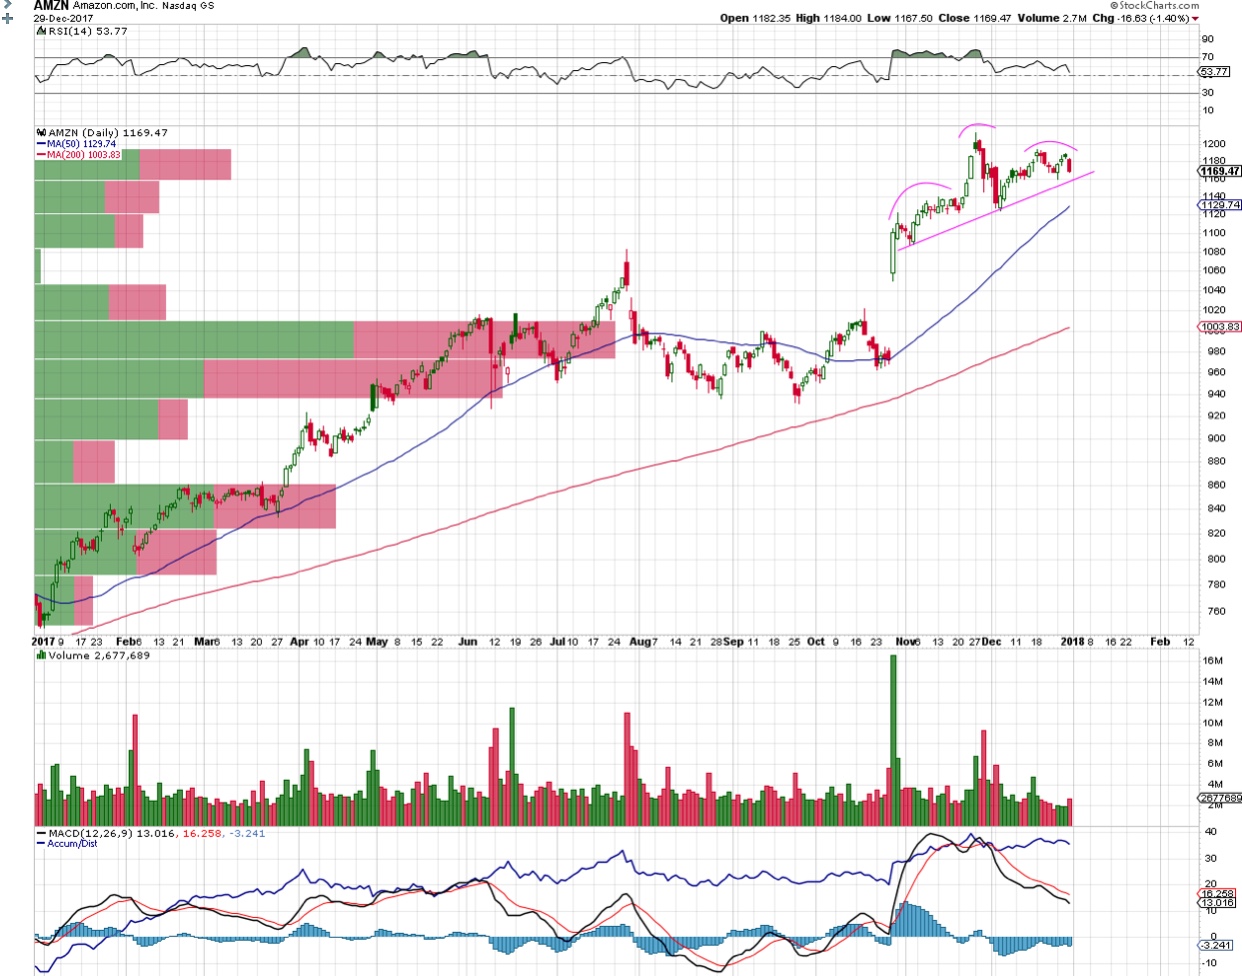
👍 bertoiarl,