Probability of Malaysian Population Increment in Percentage for 1 year
blog·@brainstorm8855·
0.000 HBDProbability of Malaysian Population Increment in Percentage for 1 year

The data that we got is the data of population of human in Malaysia starting from 1974 until 2019. We got the numbers of population then we find the increment of human in Malaysia in a 1 year period.
For example, we find the increment of human in Malaysia from 1974 until 1975. We then find also the increment of human in Malaysia from 1975 until 1976. That is so for another years until we find the last increment of our data which is increment from 2018 until 2019.
The increment of human population in Malaysia for each year that we got, we change the number of increment into the percentage of increment of human population in Malaysia.
In so, the percentage of increment of human population in Malaysia is the main of our topic today which is we are intended to analyse to find the model that we can rely is for another few years in order to find the probability of increment percentage in 1 year.
Below is the raw data and the processed data that we have done and we intend to share with all people.
Year - Malaysian Population
1974 - 11871102
1975 - 12162189
1976 - 12468688
1977 - 12790313
1978 - 13122833
1979 - 13460035
1980 - 13798094
1981 - 14134060
1982 - 14471215
1983 - 14819430
1984 - 15192300
1985 - 15598924
1986 - 16043736
1987 - 16522004
1988 - 17022470
1989 - 17528961
1990 - 18029824
1991 - 18519941
1992 - 19002660
1993 - 19484901
1994 - 19977508
1995 - 20487604
1996 - 21017619
1997 - 21562790
1998 - 22114647
1999 - 22661293
2000 - 23194252
2001 - 23709115
2002 - 24208391
2003 - 24698821
2004 - 25190647
2005 - 25690615
2006 - 26201954
2007 - 26720367
2008 - 27236003
2009 - 27735038
2010 - 28208028
2011 - 28650962
2012 - 29068189
2013 - 29468923
2014 - 29866606
2015 - 30270965
2016 - 30684652
2017 - 31104655
2018 - 31528033
2019 - 31949789
Based on the data above, we have done a few analysis and we found that the data of increment percentage of Malaysian population in each year is follow or approached with the Uniform Distribution.
We found that the data followed the Uniform Distrbution with the 95% we confident with our analysis by taking the α as 0.05.
By doing Kolmogorov Smirnov Uniform Test , we found that the value of Asymptotic Significance is 0.118 which is greater than the value of α (0.05). That is so we trusted with 95% confidence that the increment Percentage of Malaysian Population is follow the Uniform Distribution.
Below is the result that we got :
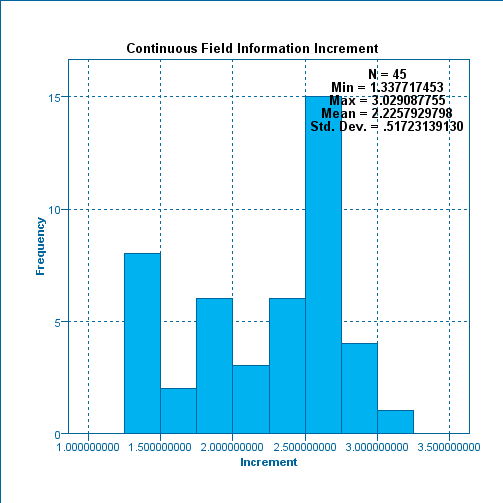
The Mean show as 2.22579298 and the Standard Deviation show as 0.51723139130. It can be said that as averagely, the increment of Malaysian Population in 1 year is at the value of 2.22579298%.
-= Kolmogorov Smirnov Uniform Test =-
Result of Kolmogorov Smirnov Uniform Test :
Asymptotic Significance : 0.118
Uniform Parameter : Minimum 1.337717453
Maximum 3.029087755
From the result we got above, we can create the probability model of Increment Percentage of Malaysian Population.
The model is as below :
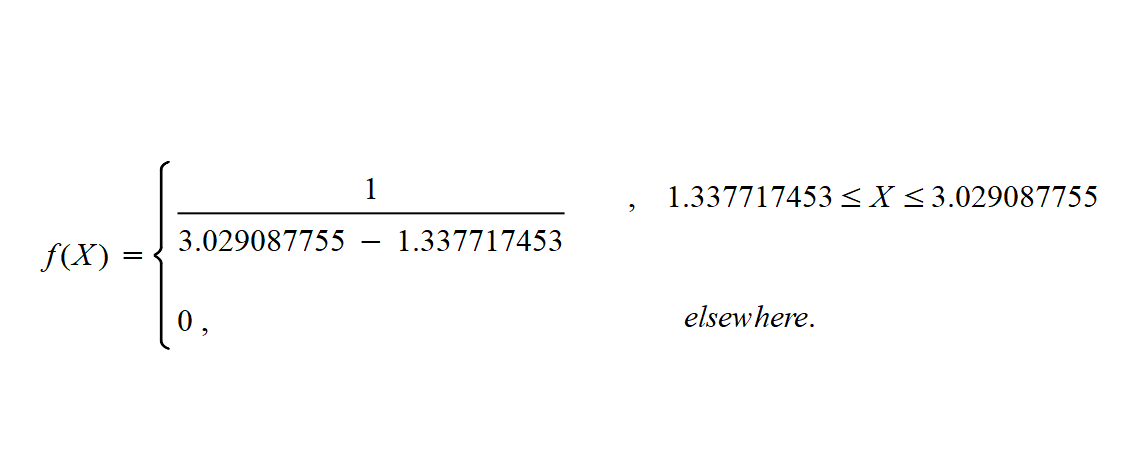
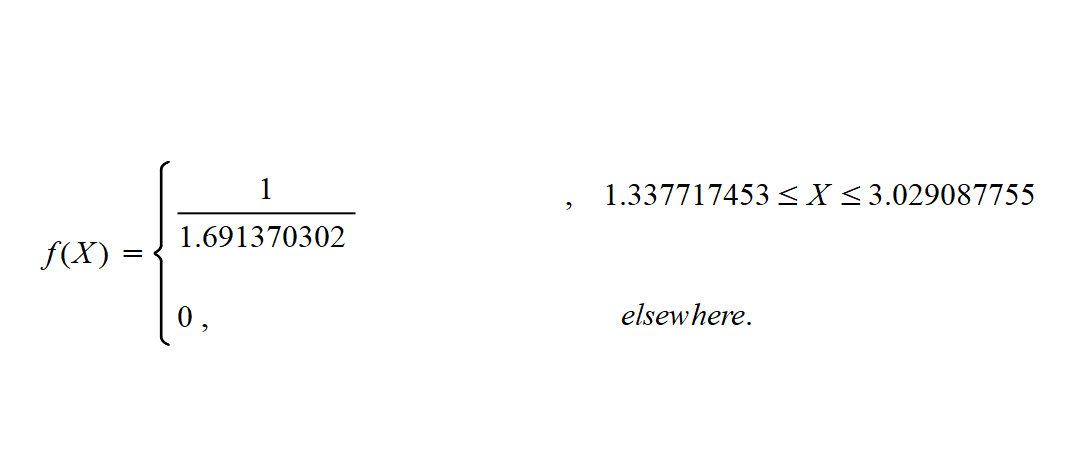
X = The Increment Percentage Of Malaysian Population in 1 year
So, as example, we want to find X, that is the Increment Percentage of Malaysian Population in a 1 year, let`s say we want to find the probability X = 2.67%,
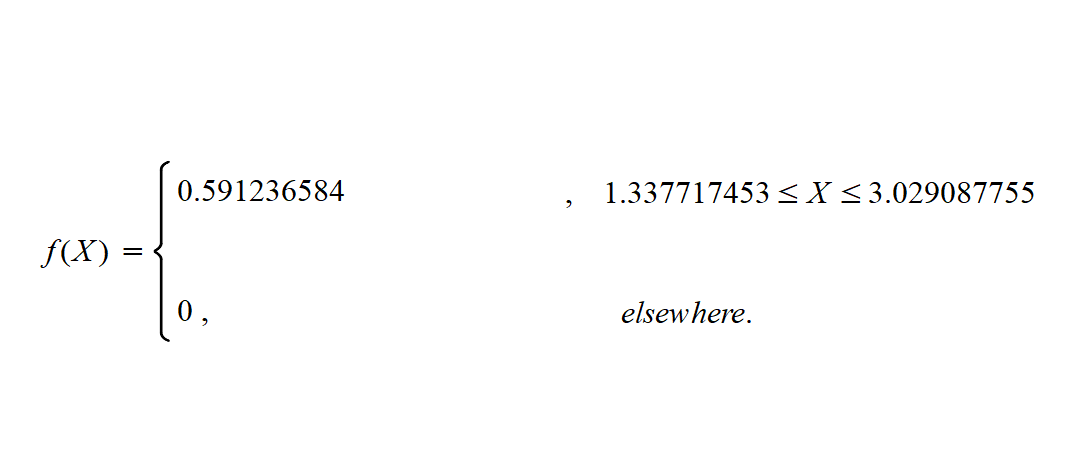
Then, base on the model above, its can be say that for any value of X between 3.029087755 and 1.337717453, the probability of X is same which is as 0.591236584.
In the other words, we can say that the PROBABILITY of Increment Percentage of Malaysian Population in 1 year, f(X), is same for all of X, Incremenr Percentage of Malaysian Population in 1 year, that is between 3.029087755 and 1.337717453.
For example, I have created a question that can be solve via the model created above.
The question is :
Find the probability for 3 years consecutively of the Increment Percentage of Malaysian Population in 1 year, which is for first year, the increment Percentage of Malaysian Population in 1 year is 2.7%, then for second year, the increment Percentage of Malaysian Population in 1 year is 5%, then for third year, the Increment Percentage of Malaysian Population in 1 year is 1.9%.
Solution :
f(2.7) x f(5) x f(1.9)
= 0.591236584 x 0 x 0.591236584
= 0
In words, it can be say that probability of X for 3 years consecutively which 1 of the 3 years that has X = 5%, the Probability for 3 years consecutively will be equal to zero. It is because f(5), the probability of X = 5 is 0. That`s all the solution.
Second question is :
Find the probability for 3 years consecutively of the Increment Percentage of Malaysian Population in 1 year if the Increment Percentage of Malaysian Population in 1 year, X, is same that is at the level as 2%.
Solution :
f(2) x f(2) x f(2)
= 0.591236584 x 0.591236584 x 0.591236584
=0.206673073
= 0.2067
= 20.67%
In words, it can be say that for first year, second year and third year the Increment Percentage of Malaysian Population is at the 2% subsequently can be achieved at the probability value as 0.2067 or 20.67%.
That`s all the result of the research of Malaysian Population Number since 1974 until 2019.