Support and Resistance As The Market Action Level
forex·@calprut·
0.000 HBDSupport and Resistance As The Market Action Level
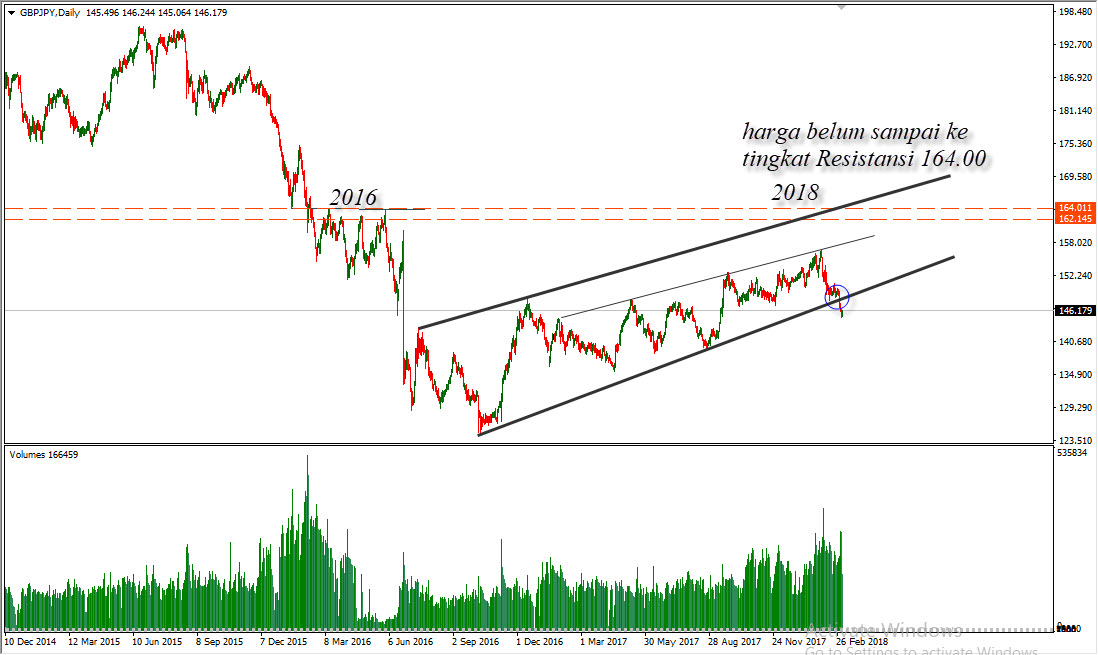
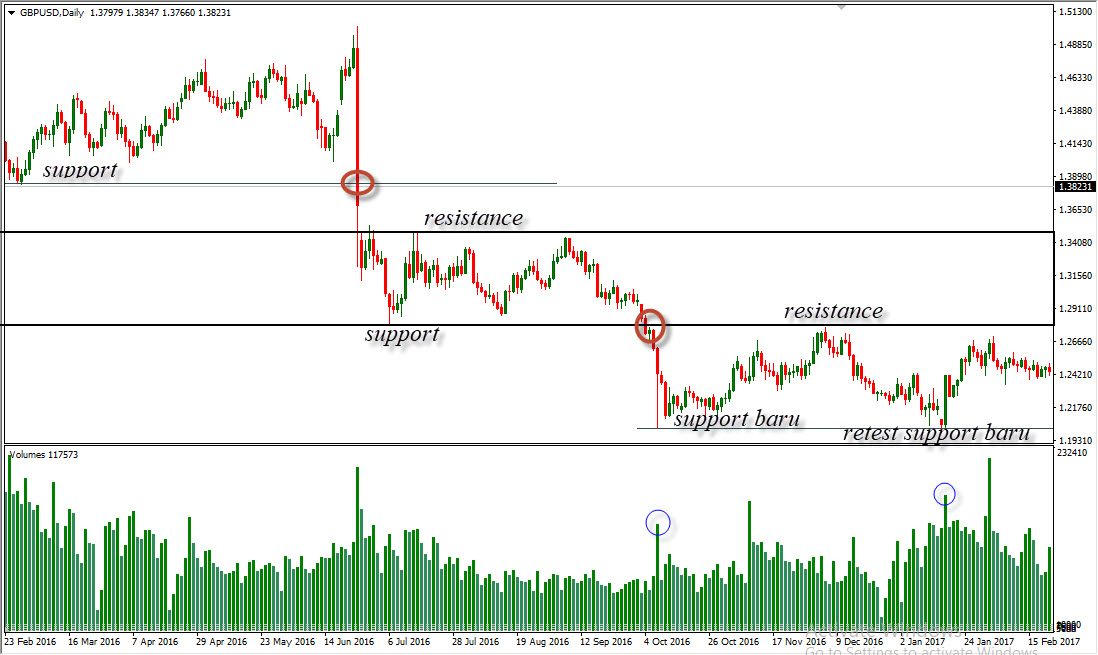
__Follow Each Other, Upvote Each Other, Comment Each Other__ 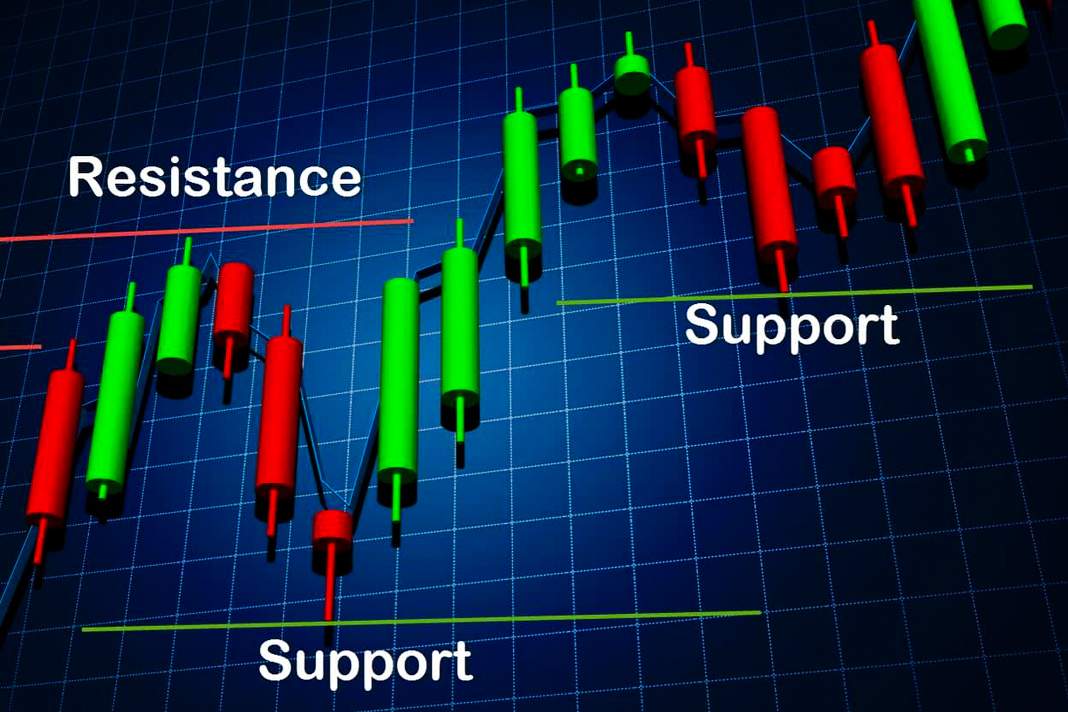 The two most basic yet effective technical patterns are the level of Support and Resistance (support and resistance). Where these levels are often labeled with trendlines or trend lines. In the event of a reflection will result in a reverse direction of the price. When the price falls, support is a momentum to buy and the price reverses. Conversely, when prices move higher, the resistance is the point where sales controls the purchase and the price hike stops. Identifying correctly the exchange of these trends will allow you to set preliminary target targets and develop your own sales discipline. As with other patterns we have discussed in previous articles, knowing the support / support details and resistance levels will increase your chances of success. The five rules of Support and Resistance are: __1. Trend Challenge__ - Support and resistance often act as trendsetters. If the labeled trendline and price are resisting, be prepared to make dynamic changes. For example, in the Palladium chart, as the blue ascending trend converges with resistance, the price moves down. 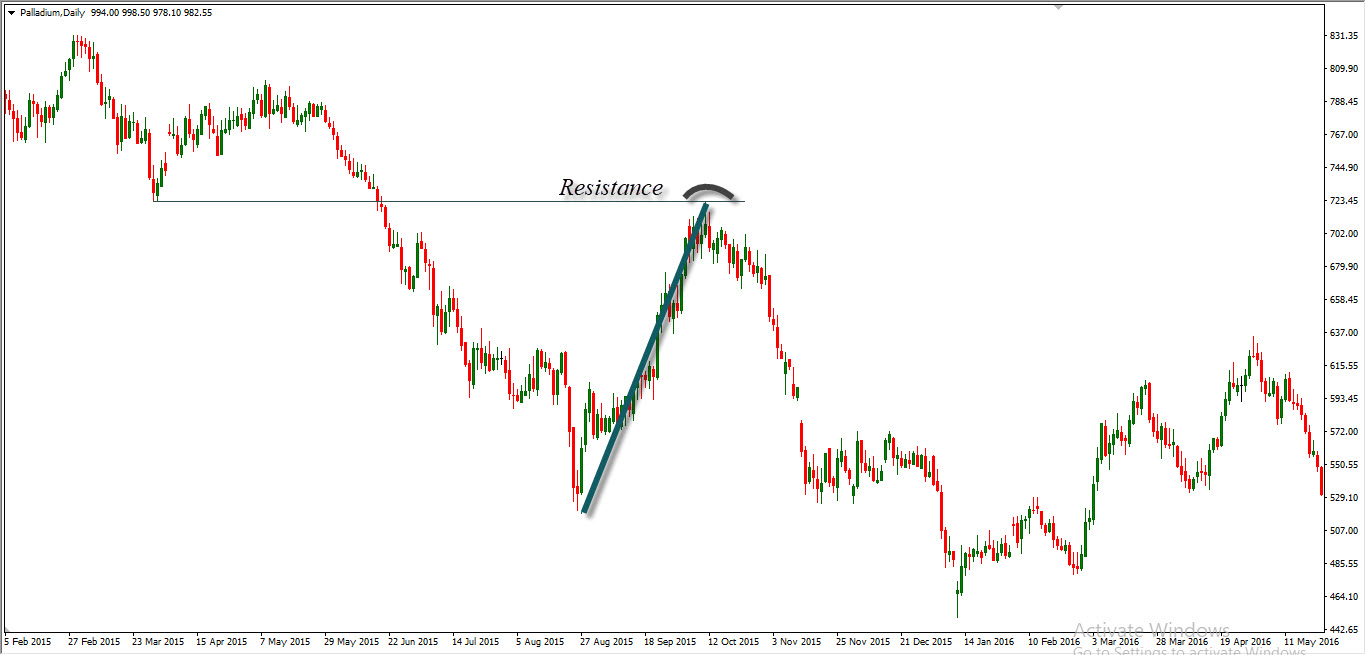 __2. Where changes occur __- If Support / support is violated, the same level will act as Resistance / Resistance in the future. As depicted by the Hangseng chart. The same horizontal trend line continues after the support is broken and the future becomes resistance / resistance line. 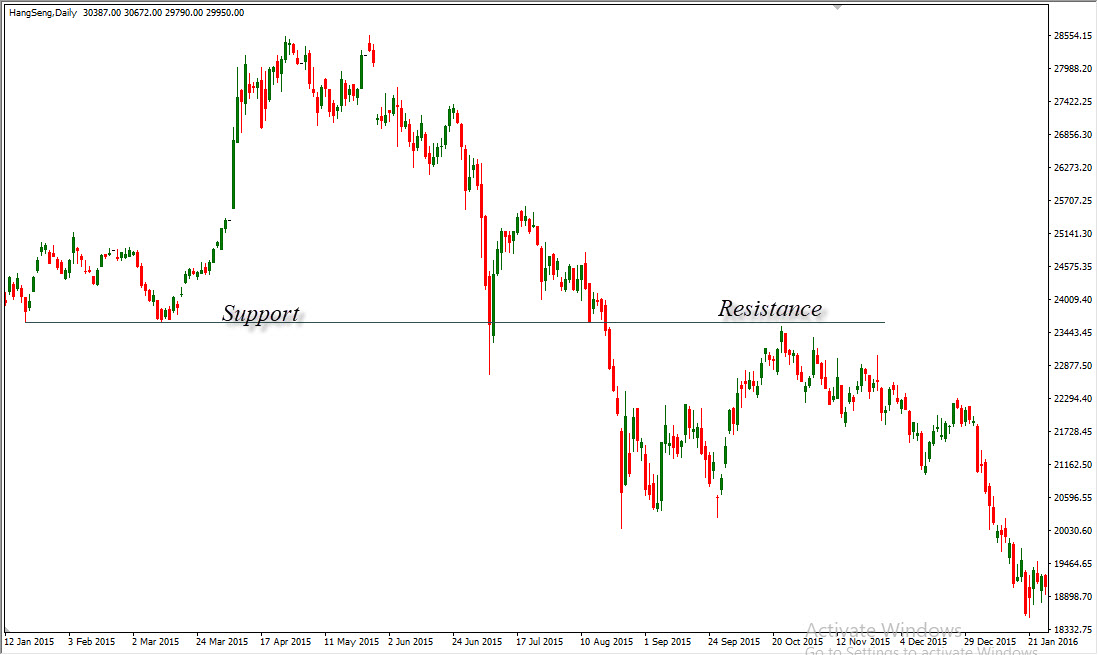 __3. Retests price becomes amplifier__ The more the trendline is tested, the more valid it becomes. GBPJPY indicates a persistent resistance at 164.00 price range. With four resistance challenges apart from this level, over a five-month period, we will see future price demonstrations at this level, where buyers spend power buying for this resistance. 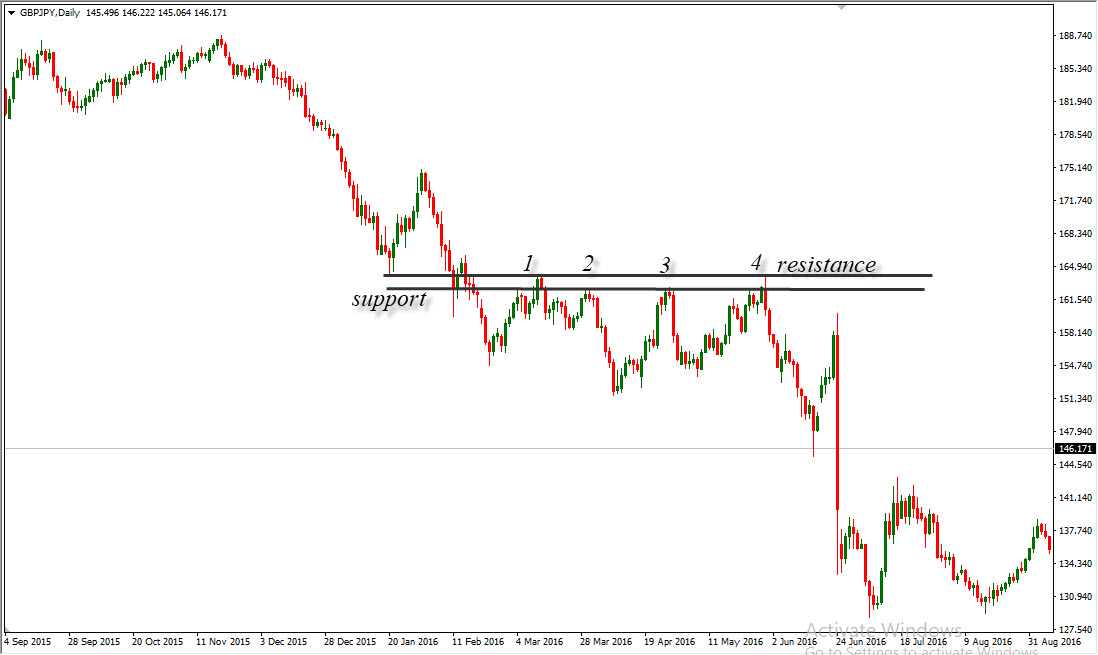 __4. Volume Booster__ - If the resistance or support level is associated with an increase in volume, the trend becomes more valid. Consider the trade history of GBPJPY. Since May 2016, the 164.00 price level has served as a strong resistance. Whenever the price level is tested, the volume increases (blue circle). This pattern adds weight and indicates that to overcome the price point it will take a long time and significant. 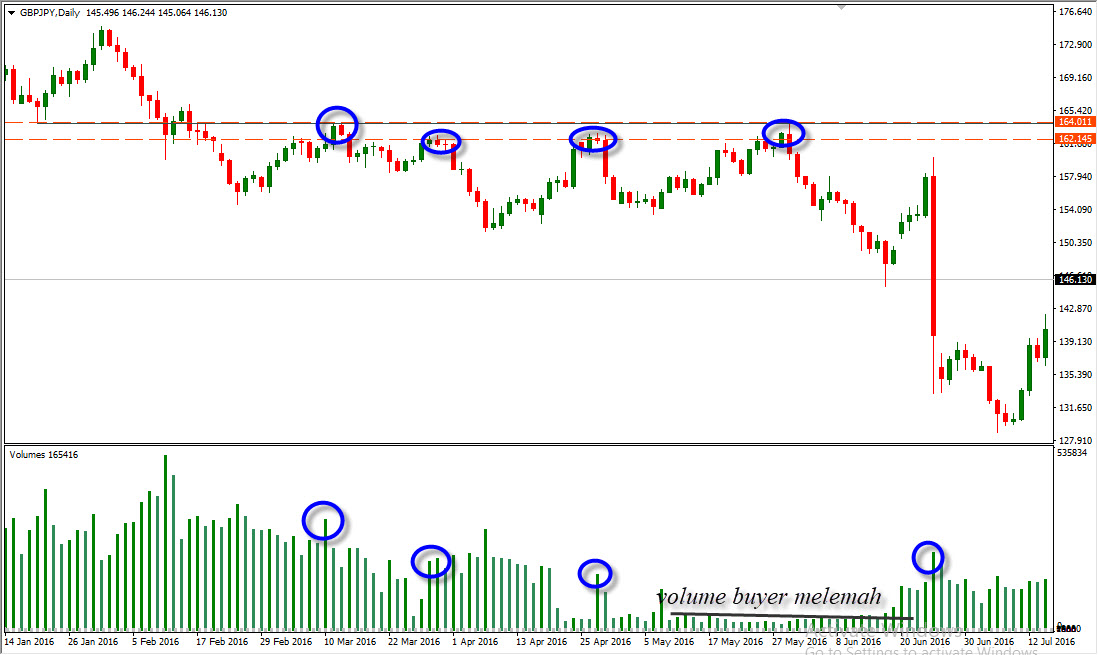 __5. Time Issues__ - Newer levels are more useful. The problem with the bearish market during brexit in Pound Sterling is that a quick loss makes many traders search for past on the support / support level. Unfortunately, grasping history is useless. Checking the 2-year GBPUSD chart, we see valid support at the 1.2000 price level. And the level of support before the new breed 2 years later filled again. It takes time and a long process in generating a trend that is formed in panic selling. 