This graph explains both the 1997 and 2010 general elections
teamuk·@candy49·
0.000 HBDThis graph explains both the 1997 and 2010 general elections
It's from the FT: 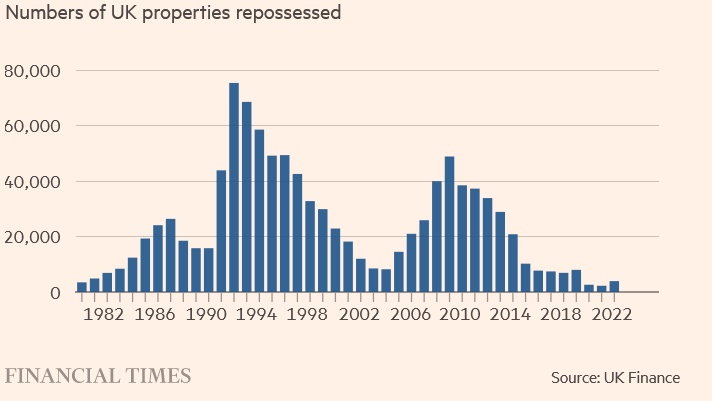 [source](https://www.ft.com/content/ac1808b6-33df-4f94-9ff2-2282f1c2bc1c) Elections are won at the margin. The swing of a few votes in a constituency can give the seat to the opposition. Now look at the graph above: by 1997, a staggering amount of reposessions had accumulated. Each one represented a tragedy. Someone losing their home, along with their hopes and dreams. They mainly represent couples, though there will be some single people there. They wouldn't be human if they weren't bitter. Of *course* they voted against the government. Their parents and siblings probably did too, out of sympathy. You get the same thing in 2010, albeit on a smaller scale. And this is why the current govt is feeling so nervous. It's true things are a little different now. In 1997, 40% owned with a mortgage and only 20% owned outright. Now 37% own outright with 26% owning with a mortgage. Still, because a few voters can cause a seat to flip, the government will try everything they can to prevent reposessions taking place. In order to have a chance in the next election, they need both inflation and interest rates to come down by the end of the year.
👍 pixelfan, elector, goldfoot, botito, tobor, hadaly, dotmatrix, curabot, chomps, freysa, lunapark, weebo, otomo, quicktrade, buffybot, hypnobot, psybot, chatbot, psychobot, misery, freebot, cresus, honeybot, dtake, quicktrades, droida, tmps, denver-bob, archonapp, taskmanager, ufm.pay, archon-mining, doubledice, upfundme, archonbank, archon-drips, archon-gov, zzz.accounting, bidnat, irisworld, ykretz, teatree, waivio.welcome, rose98734, candy49, alyssasanders,