Falling Wedge Pattern in PolyCub Price Chart
hive-167922·@chorock·
0.000 HBDFalling Wedge Pattern in PolyCub Price Chart
PolyCub price was solid while Bitcoin falling down and Luna crash. Because It was oversold and no place to drop... There is a falling wedge pattern in PolyCub Price Chart. It may be bullish pattern If price breaks up... 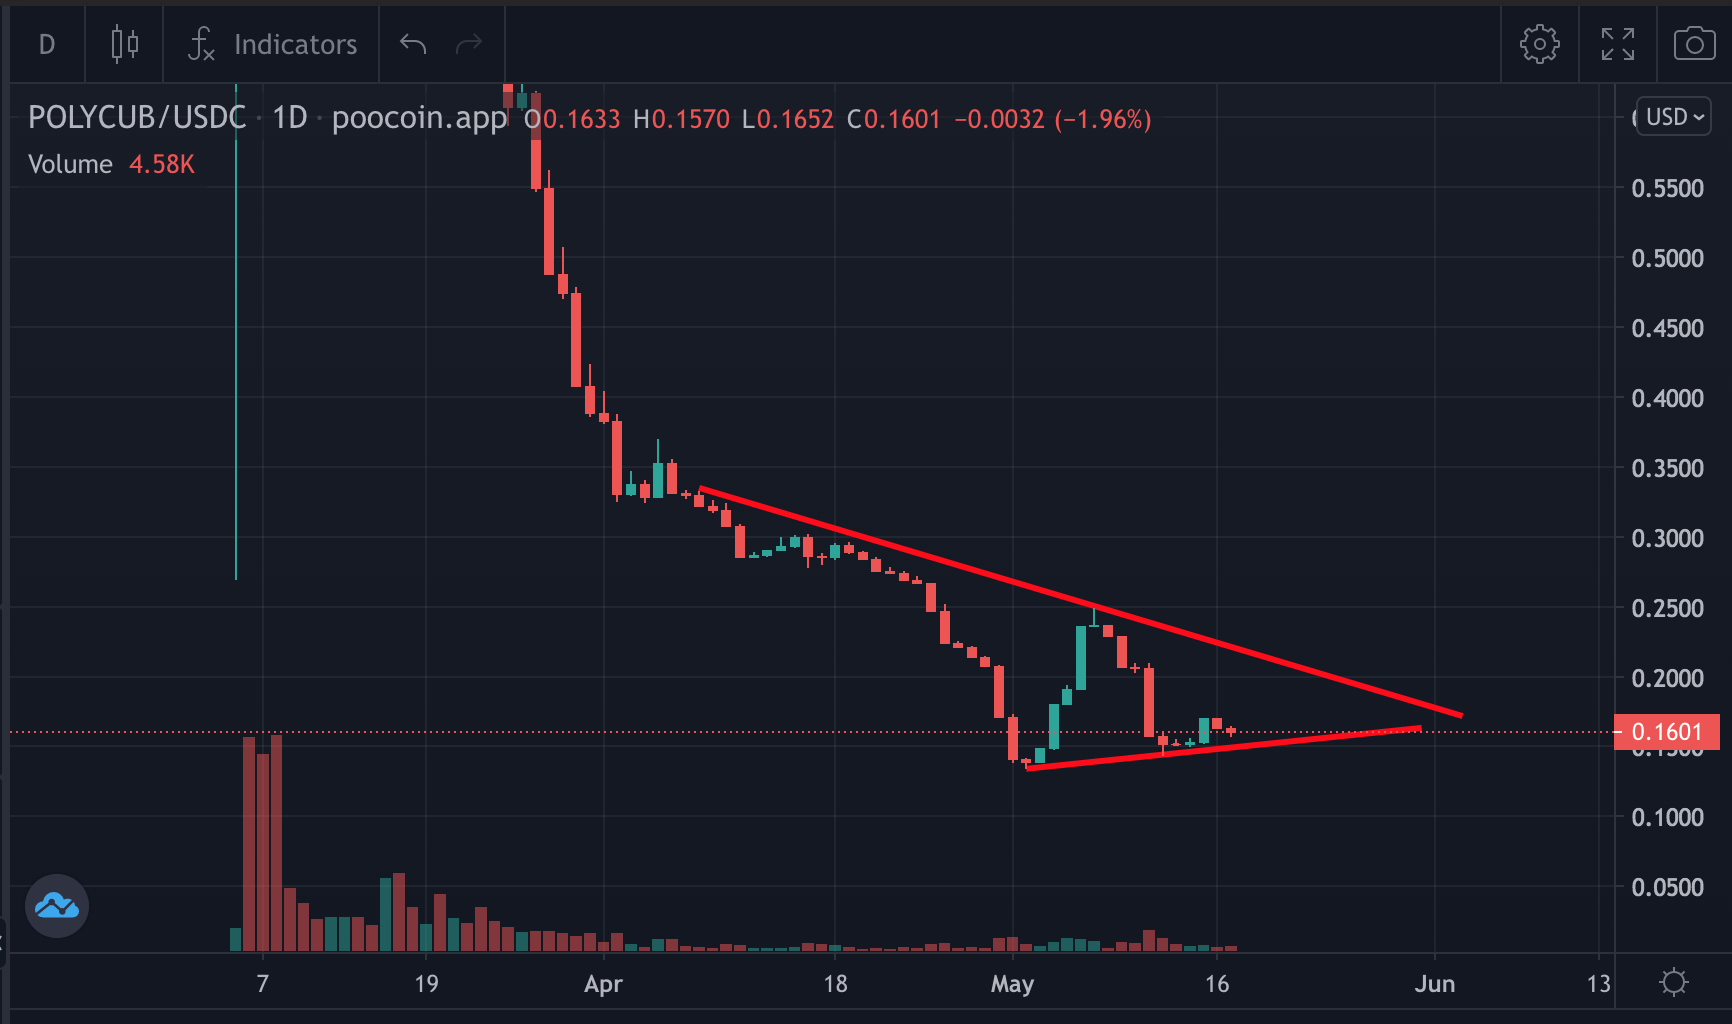 We may see PolyCub price between downtrend and uptrend lines. So, until end of the Month.. Airdrop rate will drop in June and Price may go up.. 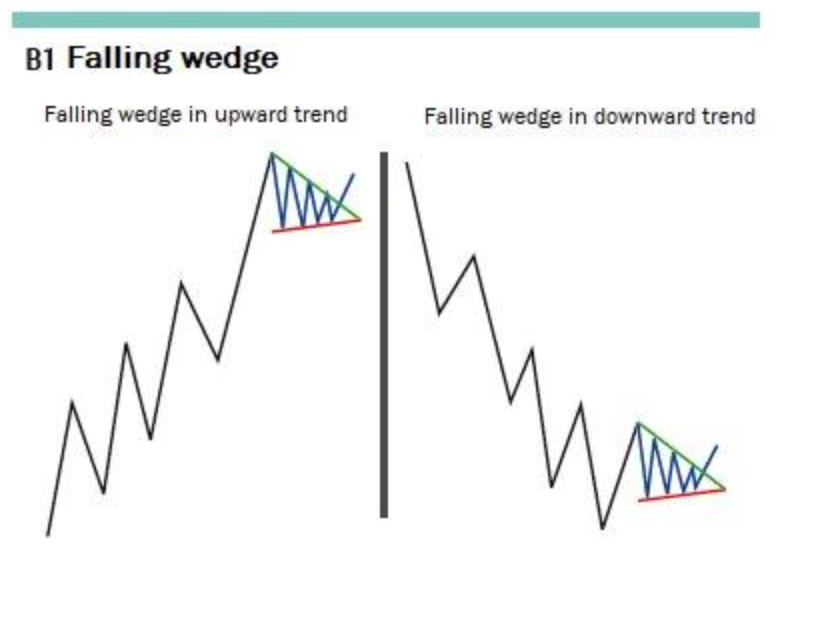 and we may complete downtrend... It may be good level to pick up PolyCub.. Market conditions is very important for all tokens.. We will see.. Posted Using [LeoFinance <sup>Beta</sup>](https://leofinance.io/@chorock/falling-wedge-pattern-in-polycub-price-chart)
👍 barmbo, borniet, kirstin, dine77, anna89, harkar, smasssh, horpey, syedumair, thales7, denizcakmak, chorock, ripperone, pixresteemer, pixelfan, munawar1235, johannpiber, andyjaypowell, geekgirl, chetanpadliya, rtonline, zemiatin, kryptodenno, dknkyz.leo, fun2learn, dknkyz, ambiguity, freedomring, stef1, benedict08, sweetkathy, plankton.token, florino, anroja, samirroo, costanza, sportfrei, kcgm, prideofleo, hive-117638, ezrider, ahmetay, brainstommer, daveks, artonmysleeve, tht, marcusantoniu26, joetunex, abduhawab, asridsyaref, tonyz, bluemoon, nainaztengra, anadolu, tinyhousecryptos, maylenasland, centtoken, mauromar, assan, lamprini, ivansnz, perfspots, hungerstream, taseli, garagenoord,