Positive Divergence on Hive Price Chart
hive-167922·@chorock·
0.000 HBDPositive Divergence on Hive Price Chart
There is positive divergence Hive price chart. We didnt see this divergence for long time. So, It may be signal for Hive Price bottom. Hive Price is going down from 0.50 USD day by day. There was no signal that say that price is on the bottom. The first signal seemed today and there is possitive divergence on Hive price chart. We need only a green candle for daily chart.. 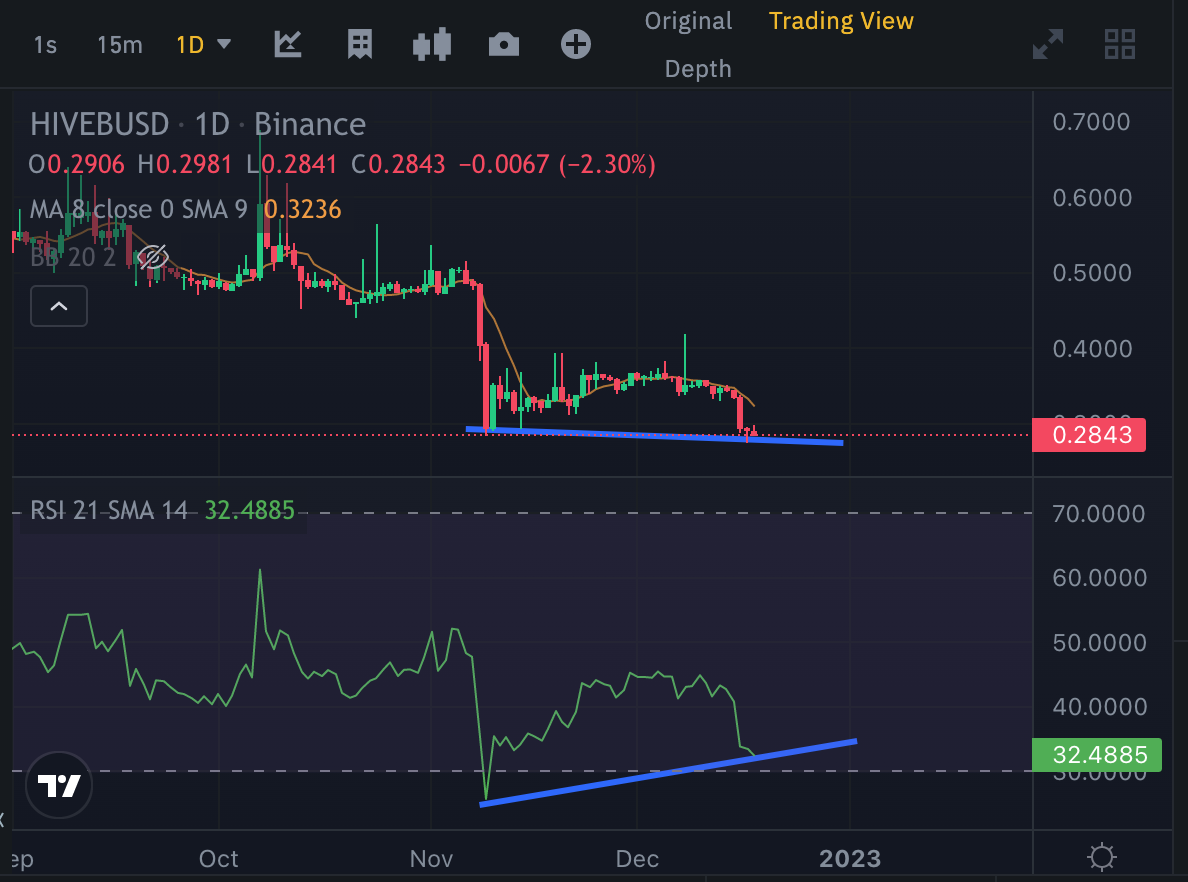 Finally we saw positive thing on the chart. We need a few positive things that reverse the price.. Hive price may be at least as stable on 0.28 USD level that may reverse MACD Indicator. Sellers are not powerful that losing power day by day. 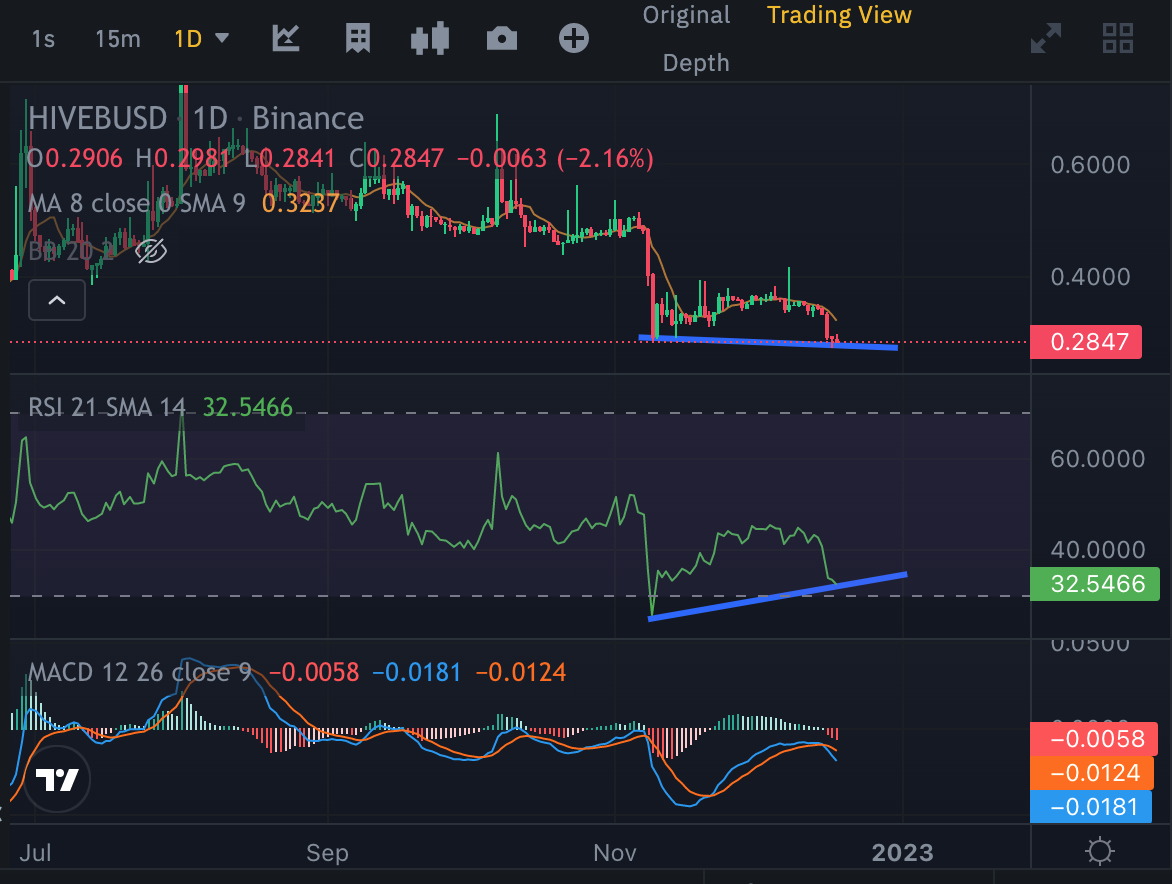 If we hold on for a few more days, we can see better days. We need only a few days.. I am waiting for Santa rally... Posted Using [LeoFinance <sup>Beta</sup>](https://leofinance.io/@chorock/positive-divergence-on-hive-price-chart)
👍 barmbo, kamchore, bilimkurgu, lamprini, gunnarheilmann, muratkbesiroglu, kirstin, bilpcoin.pay, chorock, r00sj3, sunshineee, dine77, anna89, harkar, smasssh, horpey, syedumair, stackin, zephalexia, thales7, adriansky, denizcakmak, borniet, pixelfan, andyjaypowell, offgridlife, zemiatin, pixresteemer, chetanpadliya, munawar1235, rtonline, kryptodenno, noctury, mikezillo, tht, deepu7, benedict08, ladynazgool, sweetkathy, plankton.token, florino, tggr, docmarenkristina, pablorg94, bjornb, abduhawab, mitchtokita, hickasamam, anroja, joetunex, costanza, sportfrei, bpcvoter2, ogre-radio, maarnio, valentin86, princessbusayo, cute-cactus, toofasteddie, ahmetay, tonyz, acesontop, vaynard86, bluemoon, specific-leo, daveks, artonmysleeve, marcusantoniu26, listnerds, hivebuzz, raphaelle, fengchao, arcange, achimmertens, shainemata, laruche, walterjay, pboulet, jasonbu, steemitboard, marivic10, ykretz, ukulima, assan, mauromar,