Ether chartanalysis
ether·@chrislittle·
0.000 HBDEther chartanalysis
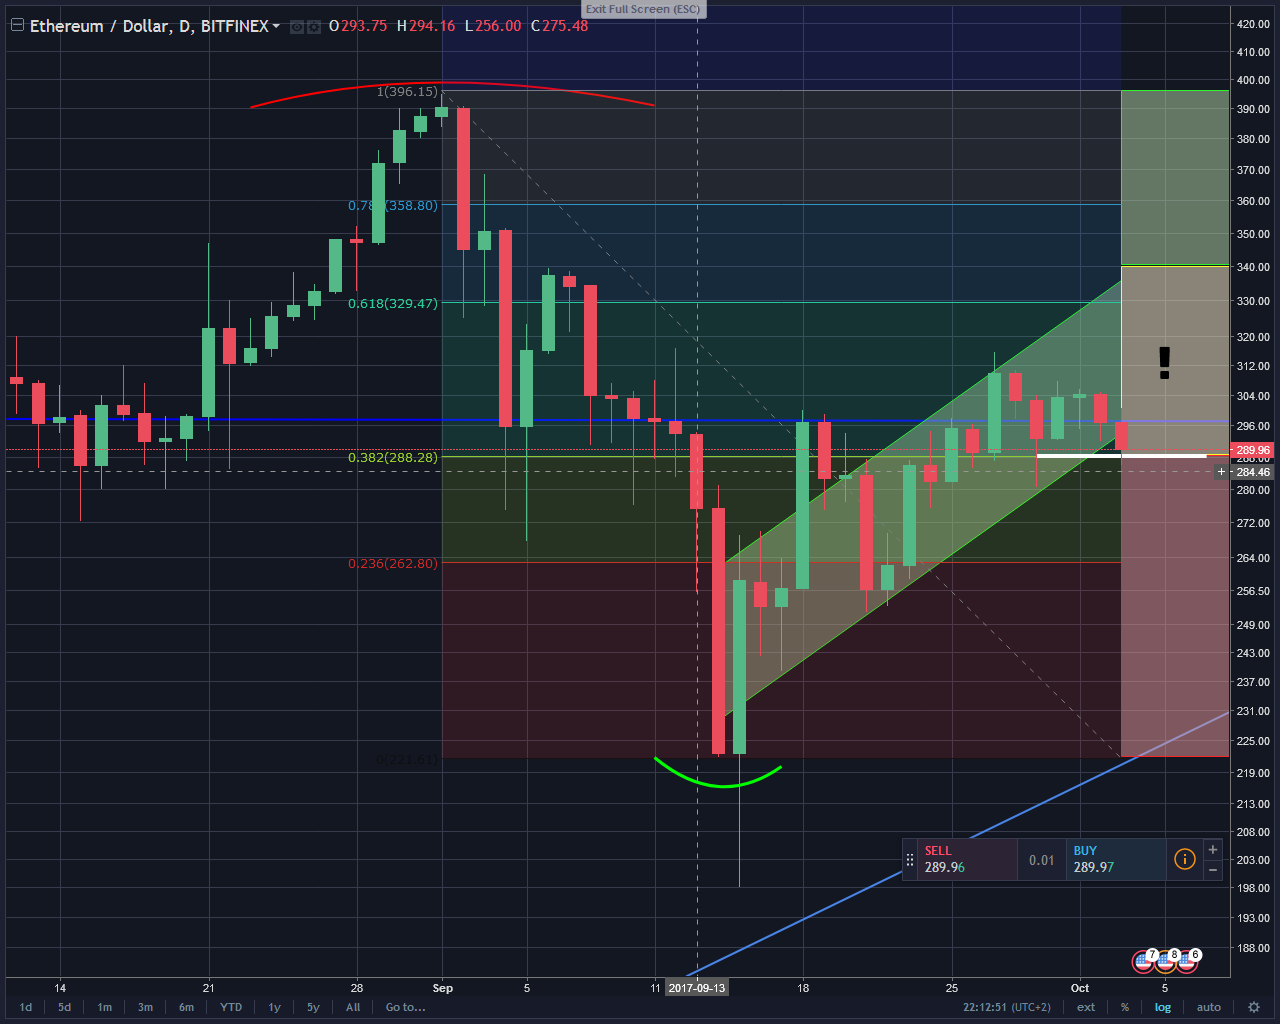 **Ethereum / USD - Bitfinex** Ether had it second alltime-high at 395$ and then fell to 222$ in only about 14 days. These two data mark the fibonacci retracement. After this decline Ether quickly recovered the losses and climbed up to 312$. Parallel to the rising courses the volume of transactions dropped. Which was the cause that the price of Ether couldn´t rise above mentioned 312$. At the moment Ether is entering in a difficult phase. **Szenario a)** Support-level (white line) at 289$, Fib 38% is strong and Ether rebounds In this case the price can easily rise when volume is also rising; what would be probably. **Szenario b)** Support-level isn´t strong enough and Ether tumbles under 289$ and beyond In that case the price would fall to 264$ (fib retracement 23%) or in a bad case even deeper. Actual (22:28 UCT+2) the price seems to stay above the support level! I would recommend not to buy until it is clear if support level holds or not. _**To make it clear: This is my personal oppinion which I like to share with you. I´m not a professional trader!**_