Bitcoin Fractal Revisit [Daytime Update + Signal]
bitcoin·@cloudconnect·
0.000 HBDBitcoin Fractal Revisit [Daytime Update + Signal]
<center><h1>Welcome to CloudConnect Studios</h1></center> <center><h3>The MultiMedia CrytpoSource</h3></center> --- --- https://steemitimages.com/DQmapQG7xhxbgj2sLE5kUgDKsHCZxzmH2uVrodt4duhL2Pc/image.png Greetings fellow producers and consumers, we are here to revisit our [post](https://steemit.com/bitcoin/@cloudconnect/massive-bitcoin-fractal-memo-warning-signs-repetition-cryptofractals-cryptobeats-cryptovids-cryptospanish) from 4 days ago where we wrote about a crypto fractal developing in the bitcoin markets. We can see today that the expected second peak has now developed. 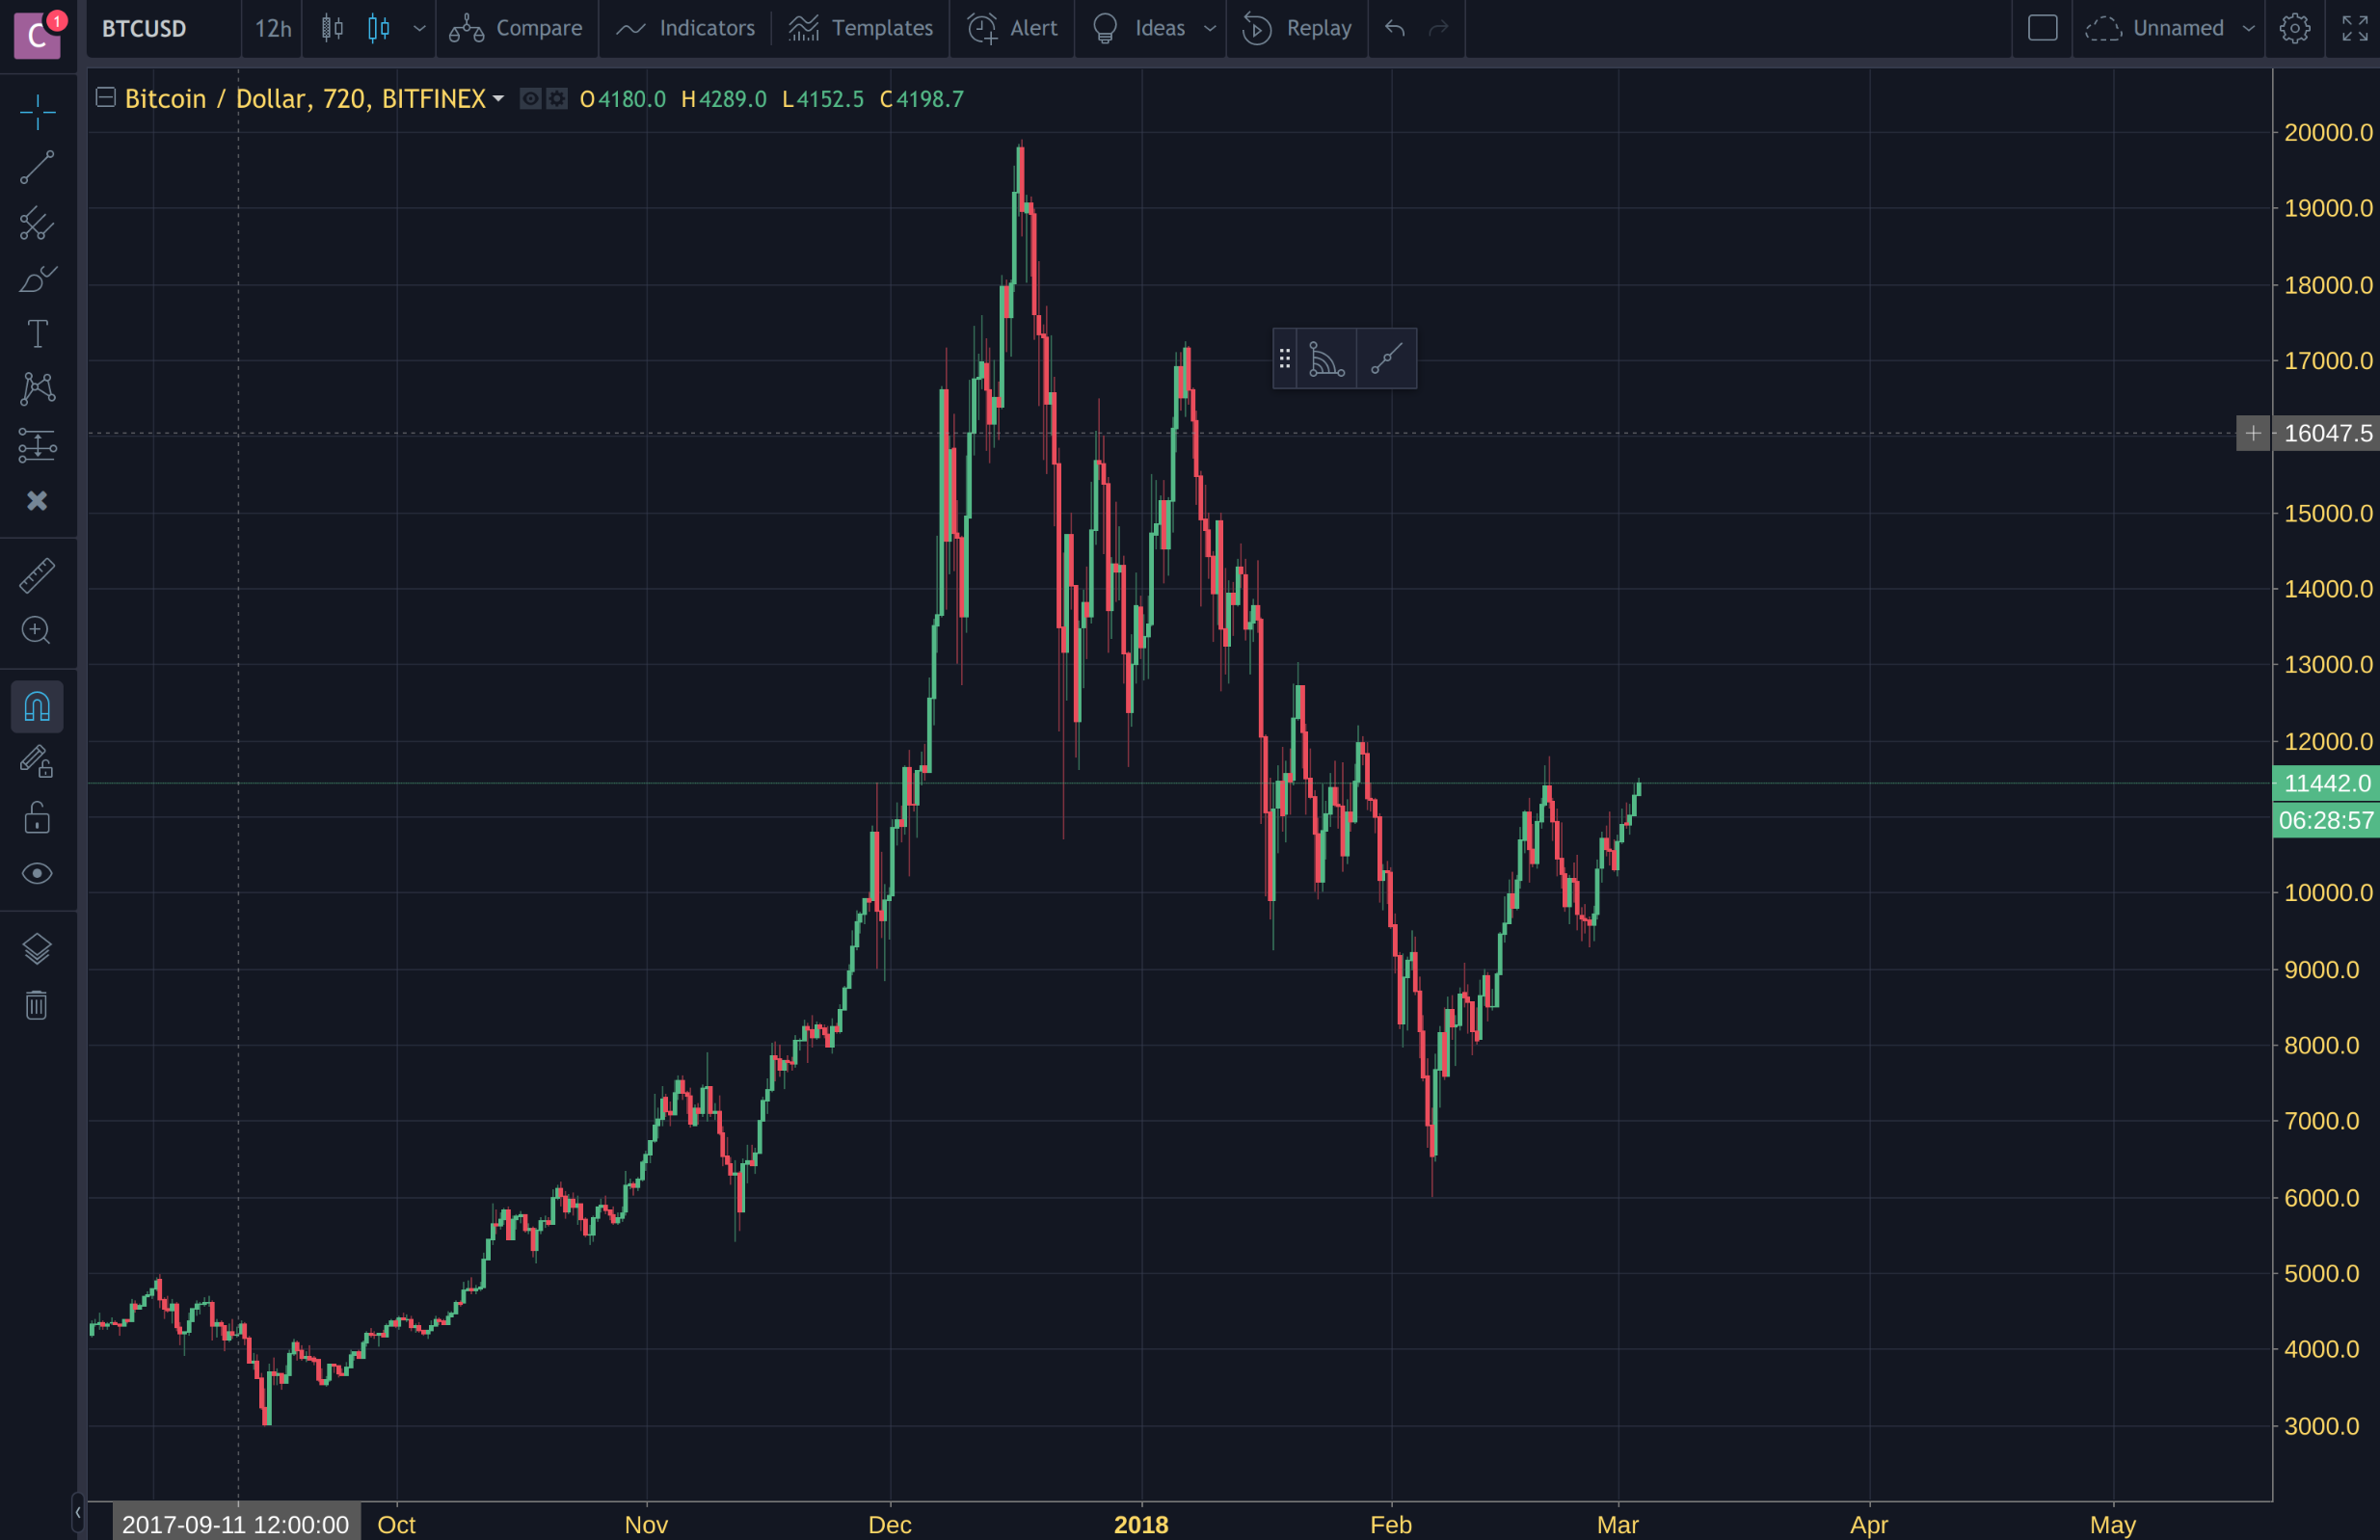 Logically, if the fractal were to be fulfilled, we are due for an imminent correction on the order of $1k-4k USD. <center><h2>***Hodlers, be still!***</h2></center> Here is an expanded view, utilizing the RSI and Bollinger Bands. 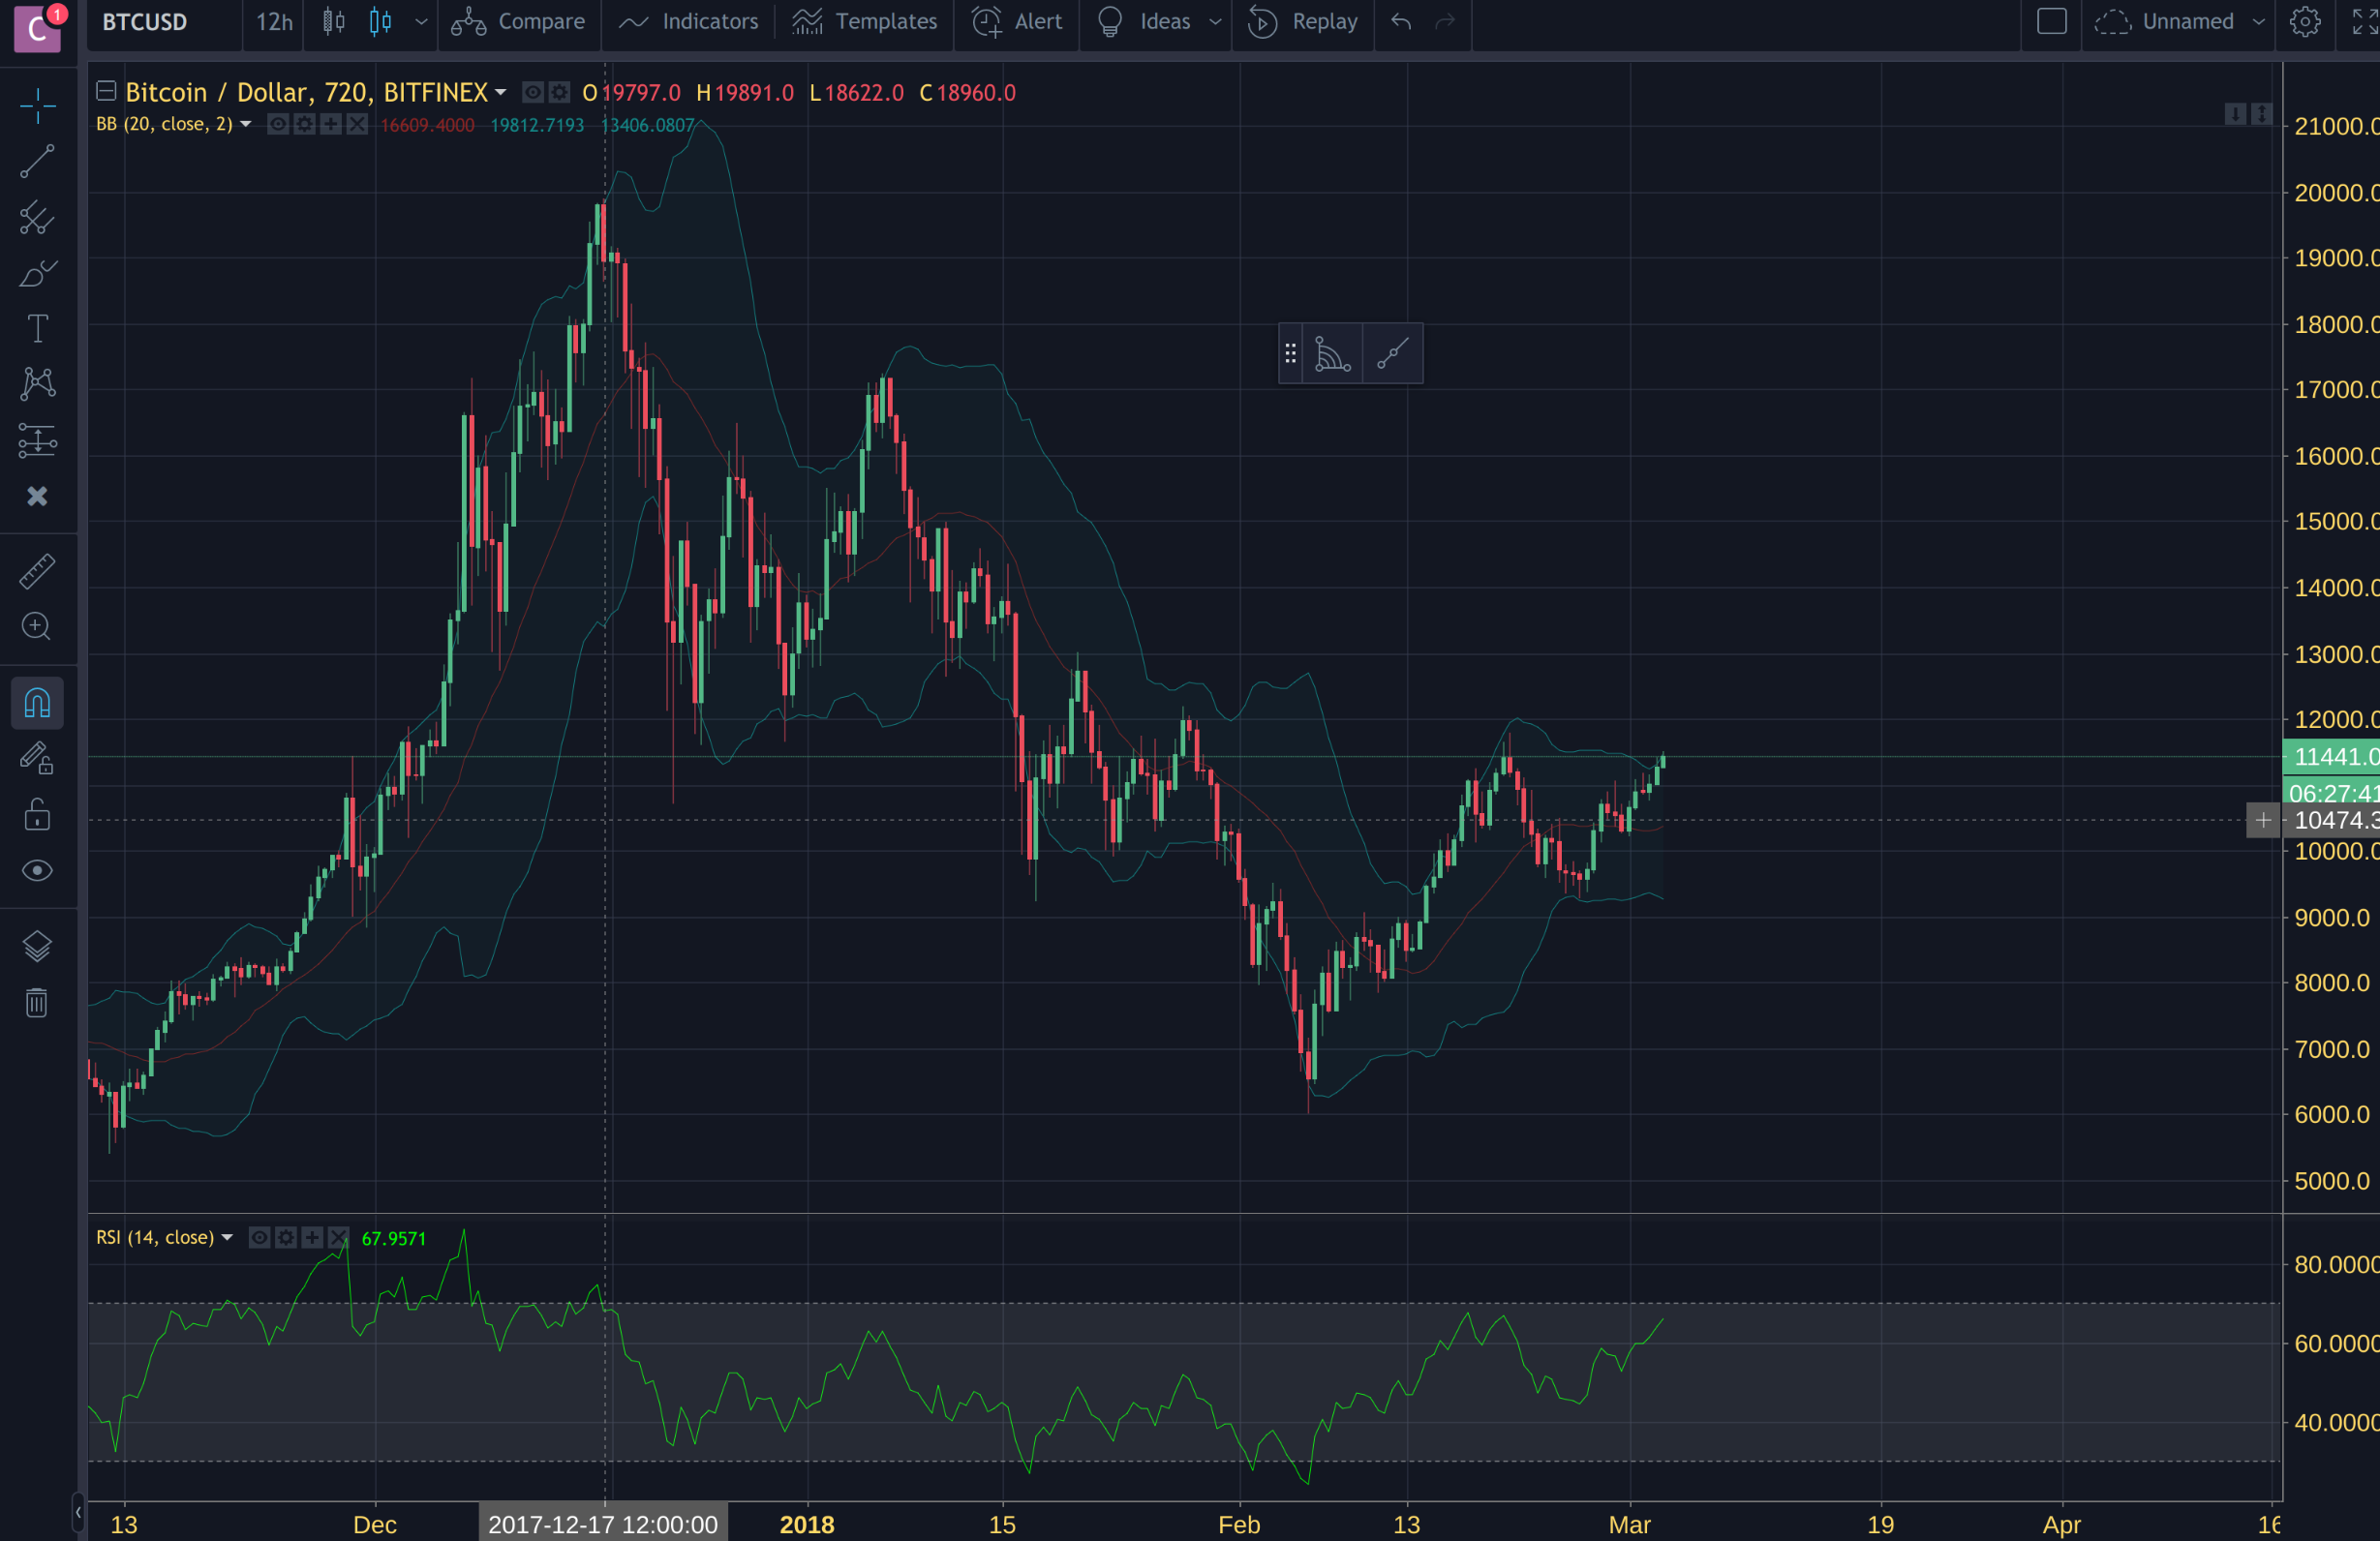 Why use those indicators? Bollingers show 2 Standard Deviations, and give us a perspective on the Volatility. Combined with the Relative Strength Index, we wait for a moment where the Candles break the Bollinger Bands above or below and the RSI breaks above 70 (or 80 for some people) or below 30 (people have differing opinions about the magical boundary). If the Bands are broken above, and the RSI passes above 70, that could be indicating a reversal. <h3>***In Markets... Nothing is perfect, everything is interpretation, humans will be monkeys, etc and so forth.***</h3> I wanted to look at the Visible Range, too. Zooming in more w/ higher resolution: 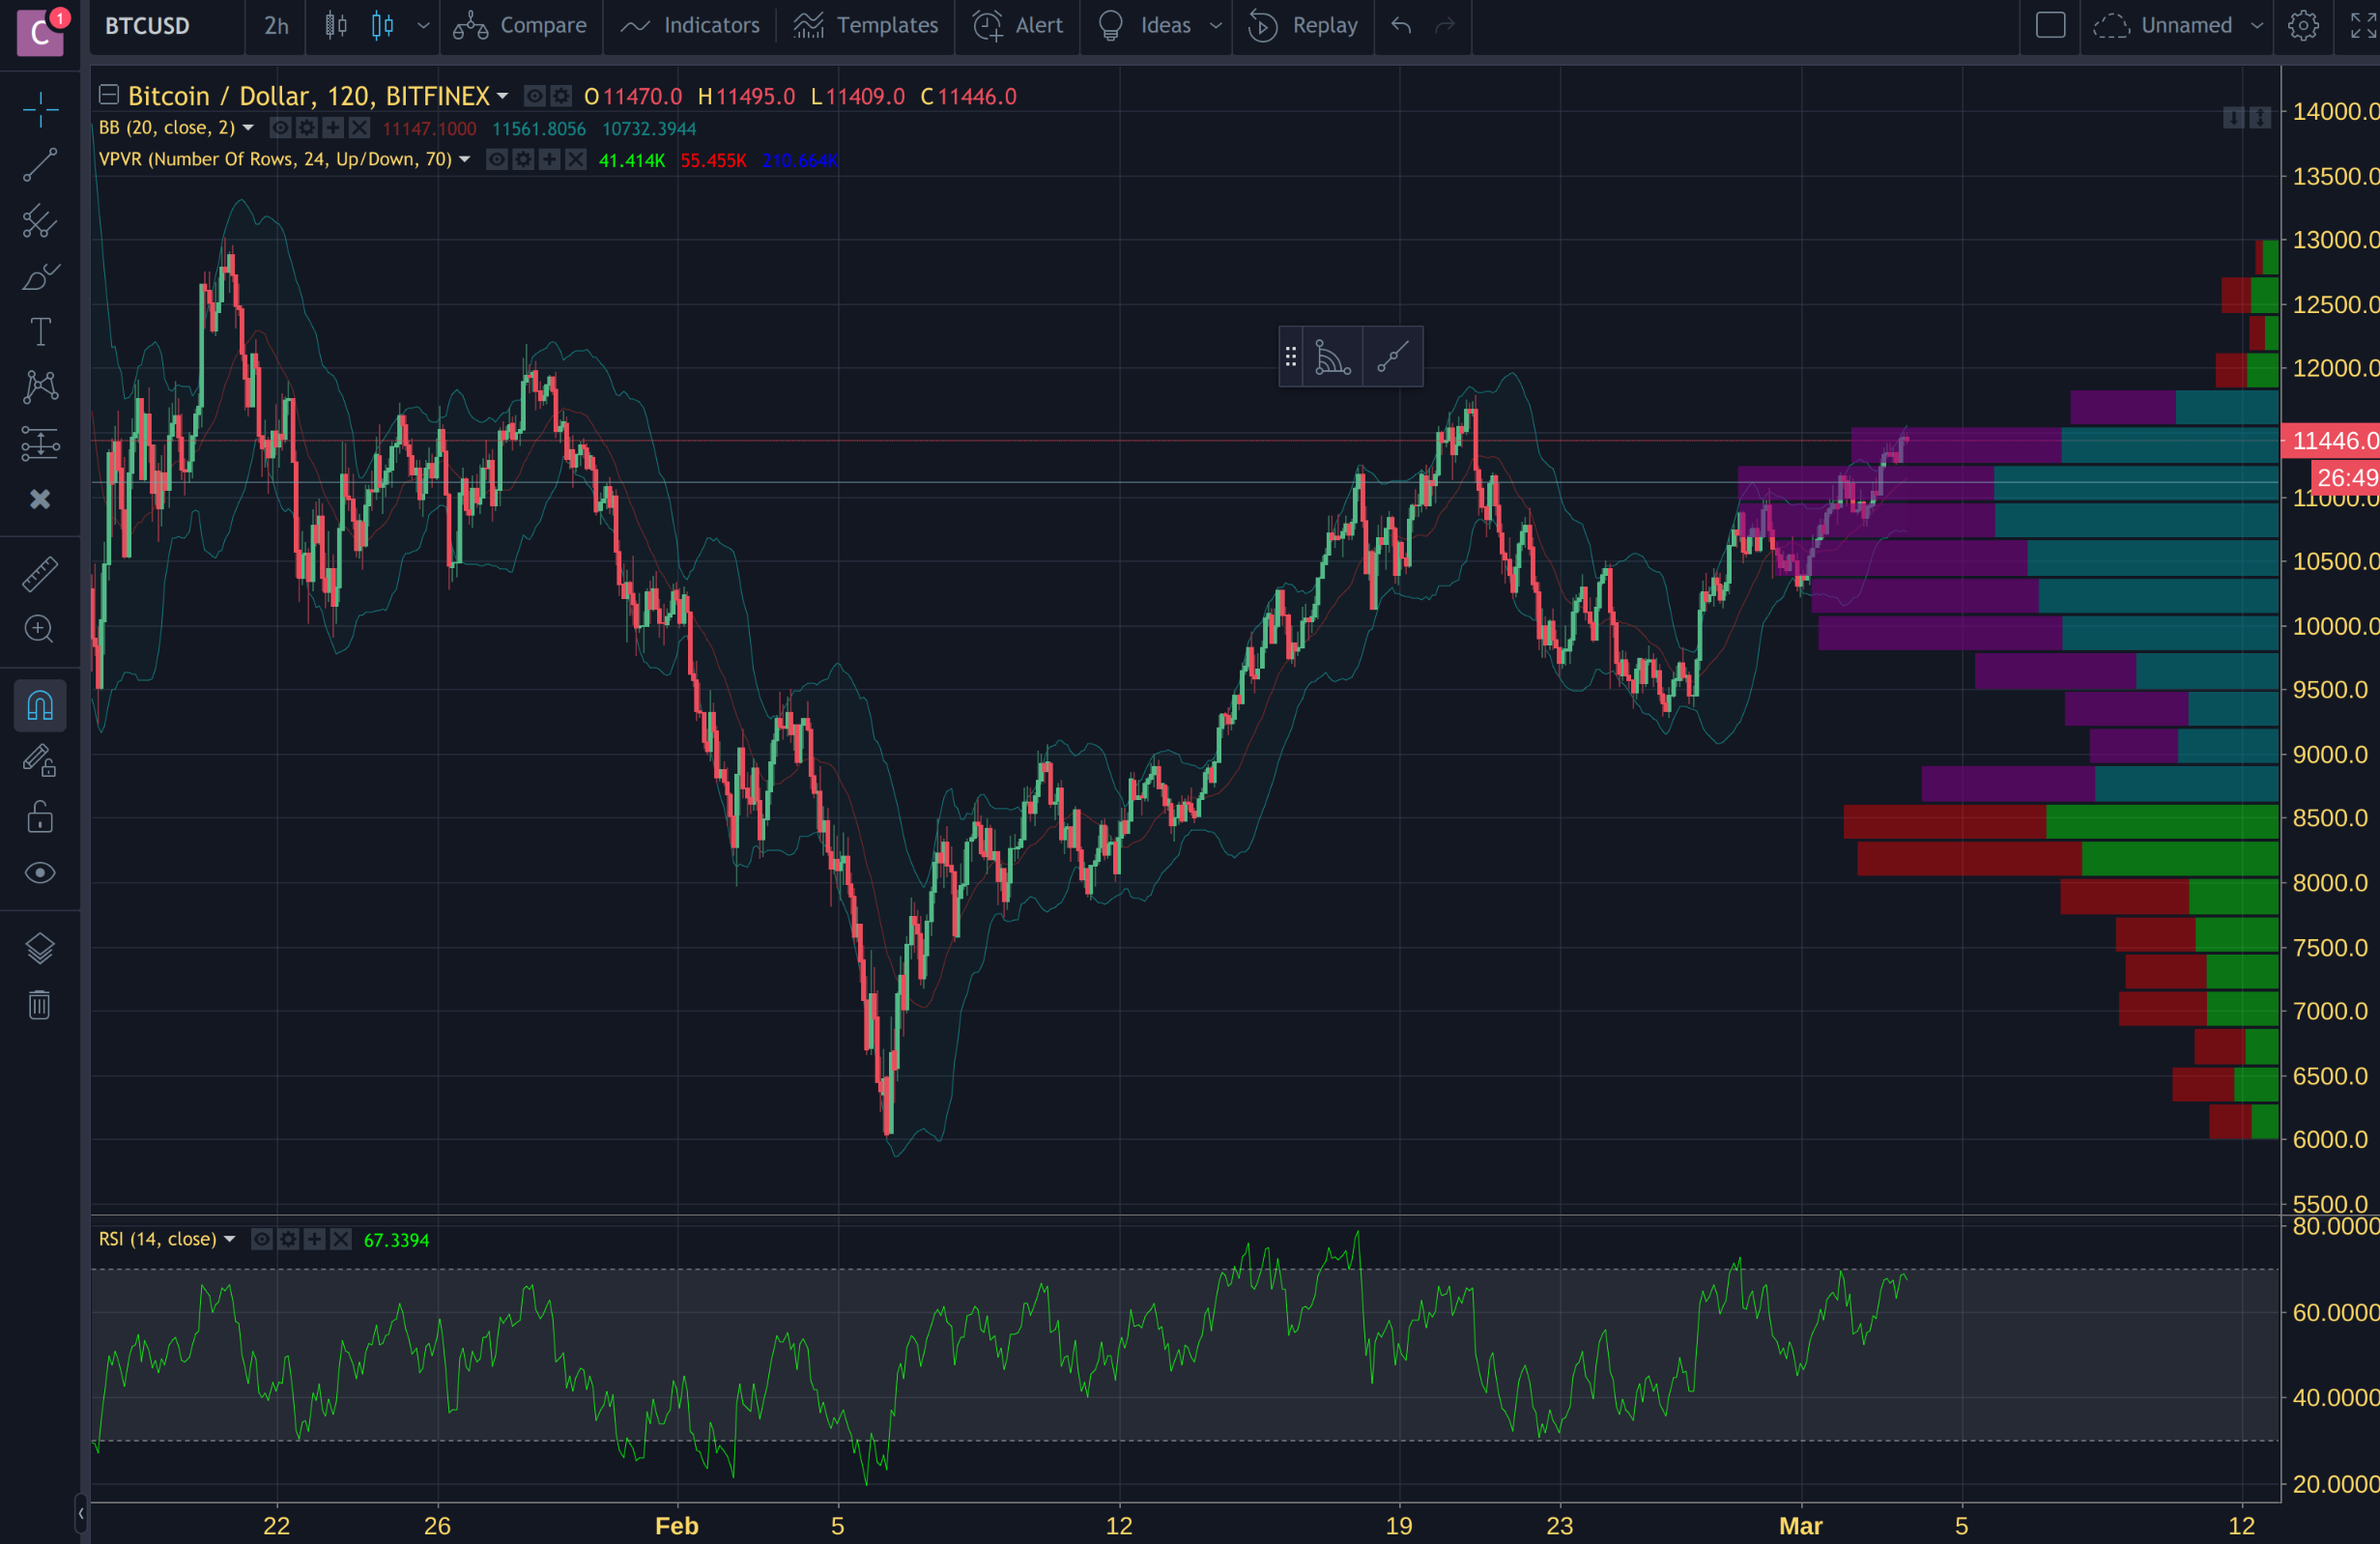 From this visible range, the Visible Range Indicator seems to indicate that this recent local ATH has reached near the ceiling of what is precedented. We can expect that the market will now call into question if it is strong enough to break resistance, or too weak. If the latter, we can expect the falling to the next major support base. IF the fractal is fulfilled, as I wrote above, we might expect the loss of a couple grand in USD. BUT DON'T be fooled, the overall vibe I get from the markets is BULLISH. Good Luck! Peace, CloudConnect
👍 cloudconnect, lam-lights, boostuff, opaulo, rycharde, hr1, lovejuice, adriatik, jerrybanfield, aksdwi, smartsteem, twanz, minnowsupport, edrivegom, stephen.king989, jhermanbeans, steemprentice, pomperipossa, numpypython, shellyduncan, qwasert, cryptohustler, myday, nannal, pheonike, decibel, gamerveda, baufestzoose, jgr33nwood, cloudjester, tgras,