Why is all the big cryptos pegged almost exactly to each other?
bitcoin·@colicoid·
0.000 HBDWhy is all the big cryptos pegged almost exactly to each other?
I find the large cap crypto currencies suspiciously similar in price action. So I overlaid the Bitcoin price chart (blue line) on top of Etherium, Litecoin, Bitcoin Cash and Ripple. Guess what, they are almost identical! Am I missing something here? Am I not using the tools correctly or something? Or is this simply what whale bot price manipulation look like? What do you think? Here are the graphs. Etherium 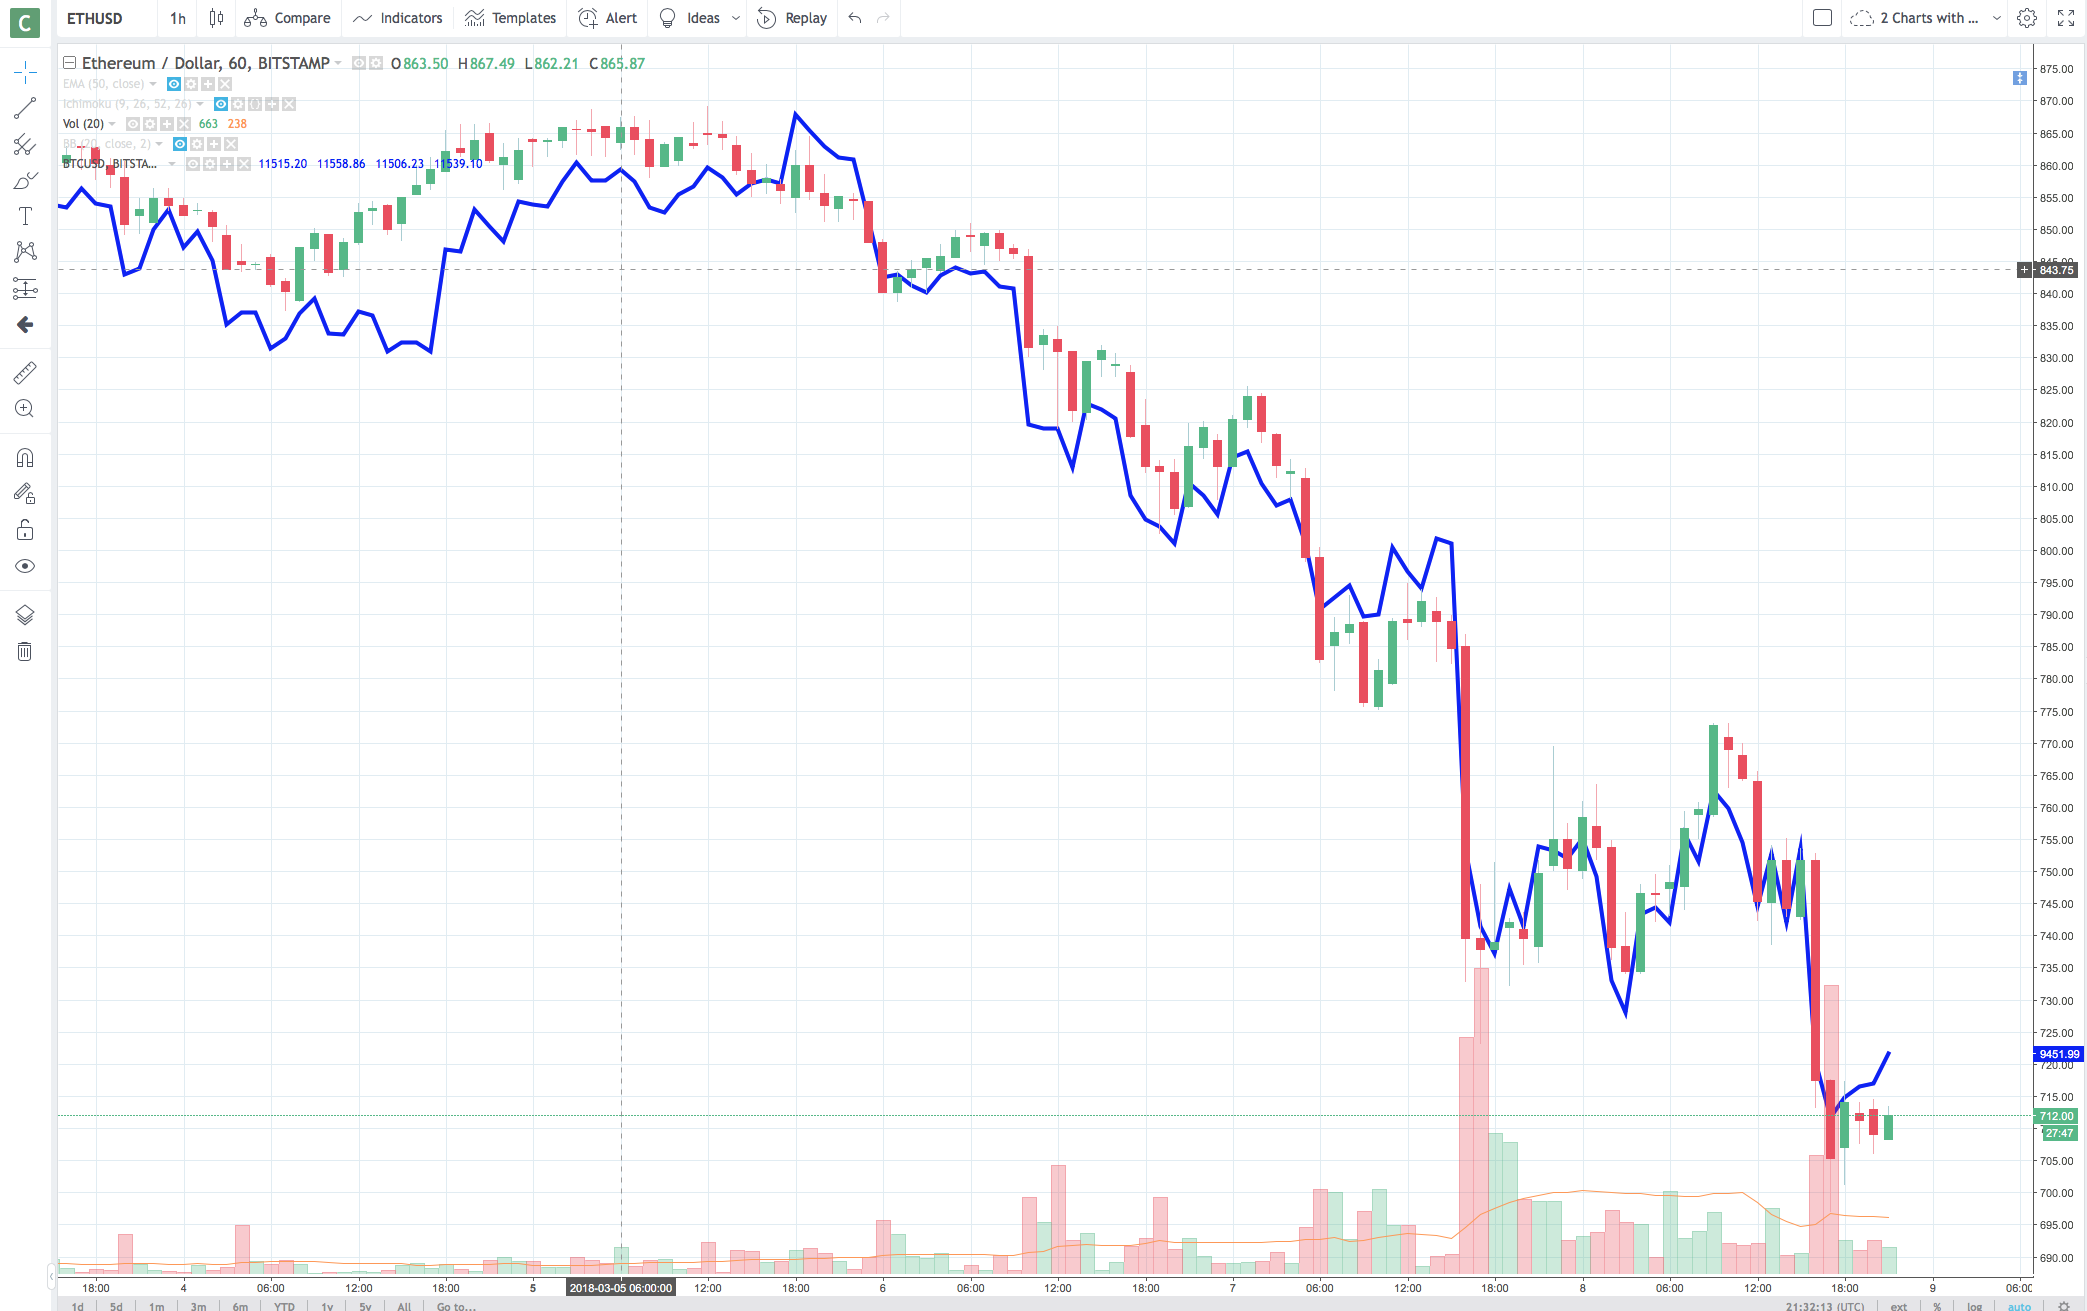 Litecoin  Bitcoin Cash 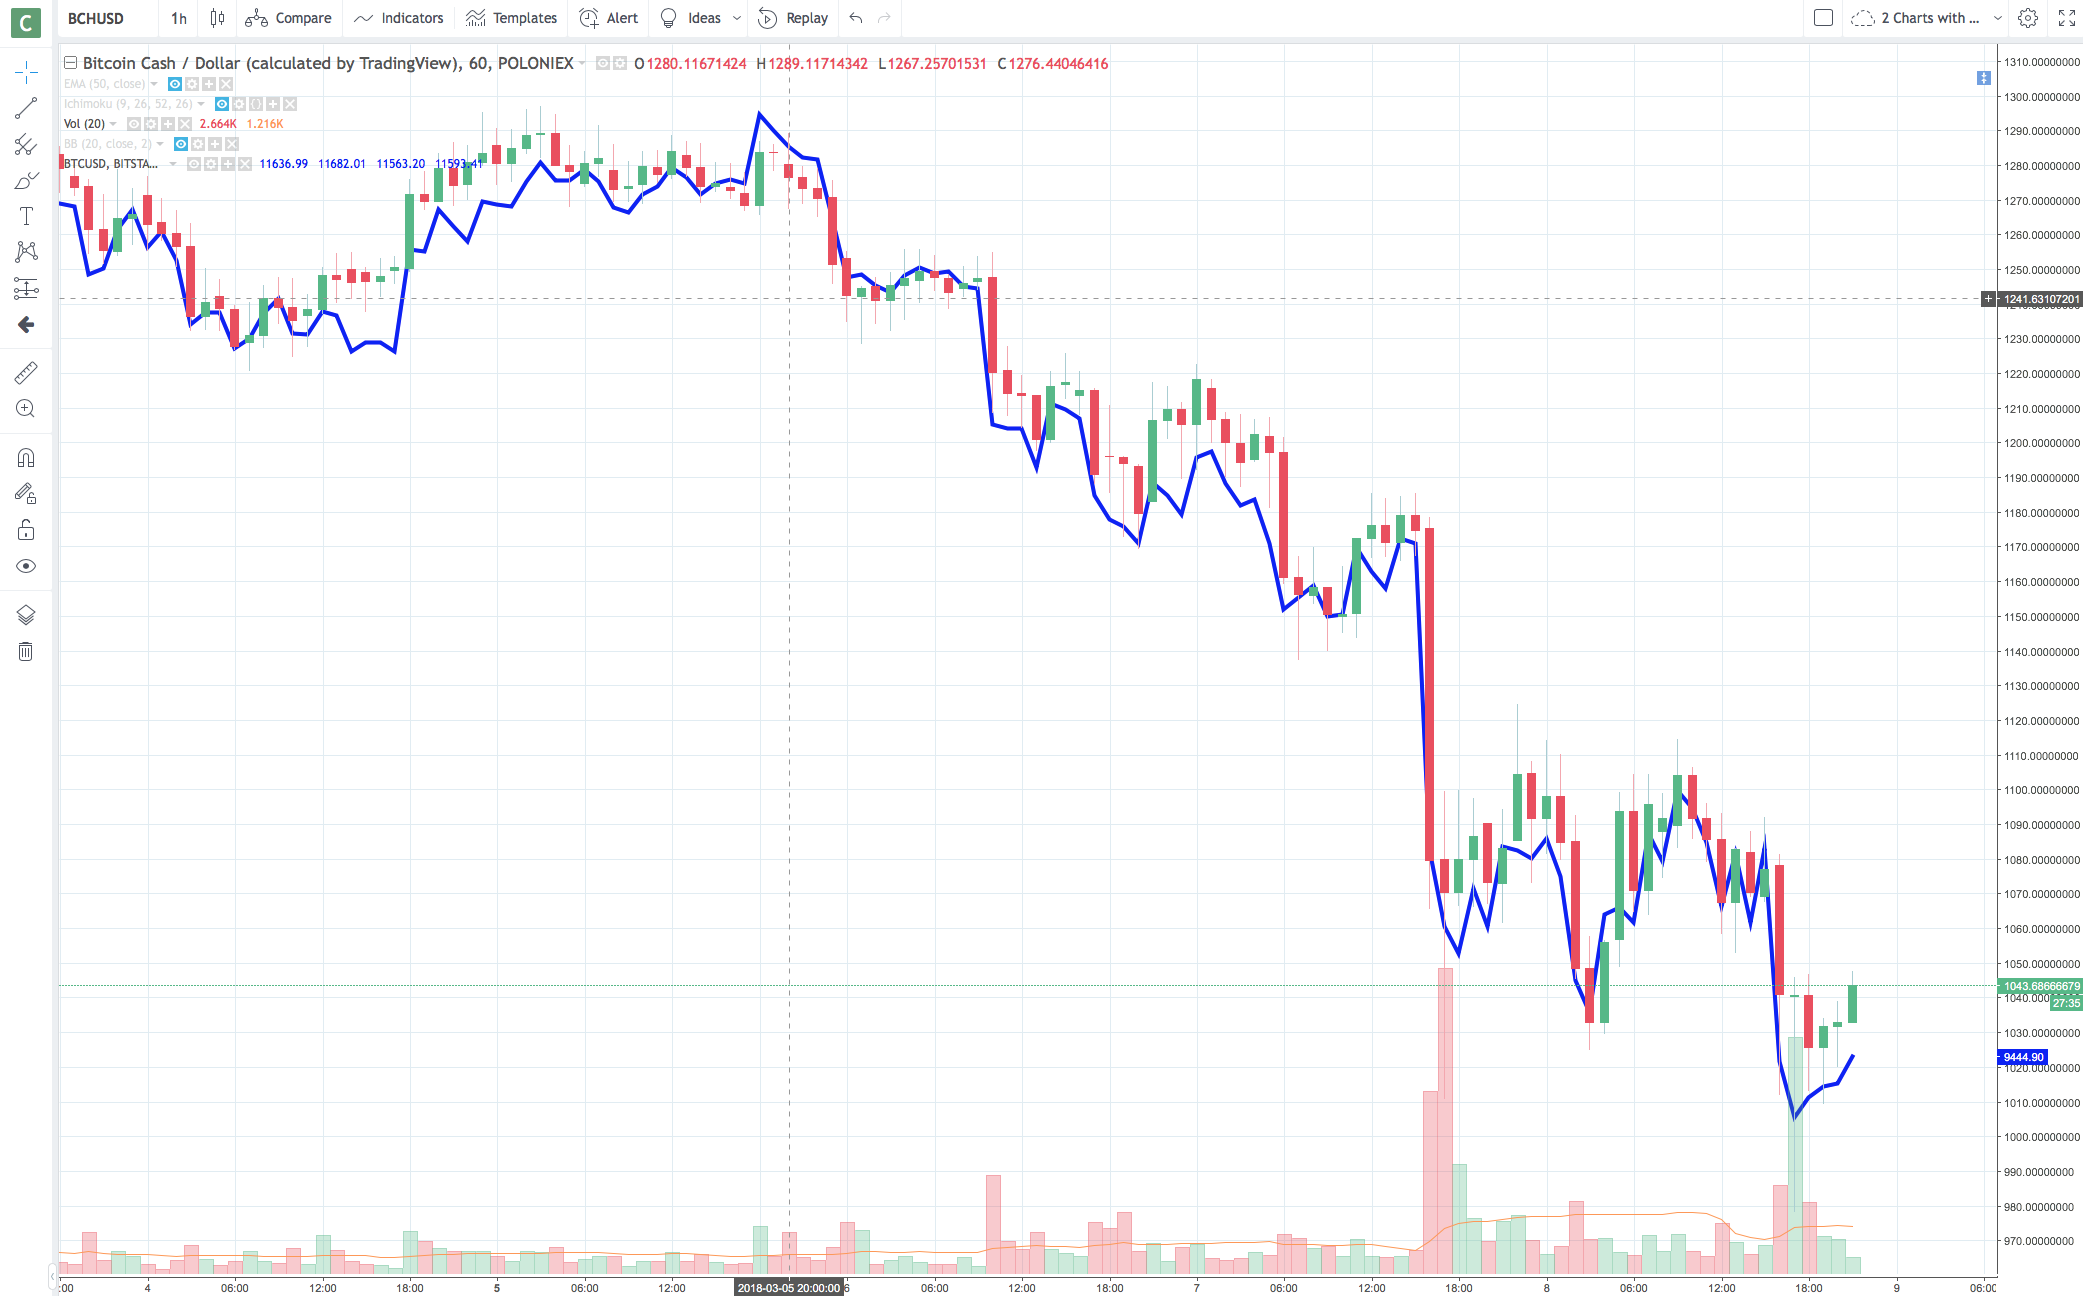 Ripple 