Ethereum (ETH) - Technical Analysis - Bullish triangle forming. ETA to breakout 1-2 days!
cryptocurrencies·@cryptobroye·
0.000 HBDEthereum (ETH) - Technical Analysis - Bullish triangle forming. ETA to breakout 1-2 days!
Hi all, Analysis of the ETH hourly chart shows us a strong bullish triangle forming, and with the recent move up and the strong rejection of the 61.8% Fibonacci on the daily chart we see ETH as bullish over-all. With this bullish incentive in mind, we can use the recent bullish triangle formation to enter a trade or to manage positions we already hold. FIG.1 - 61.8% Fibonacci retrace from last years explosion 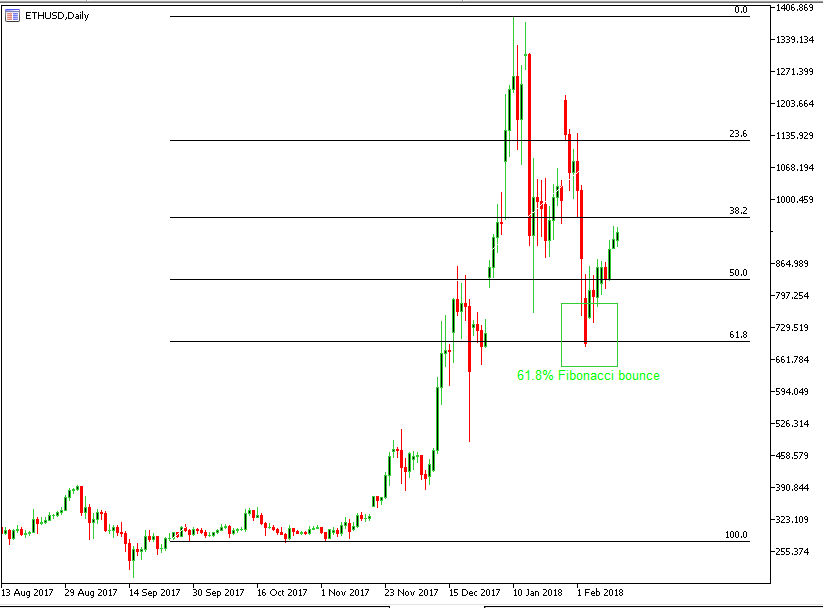 FIG.2 - Below we can see the triangle currently in formation on the hourly chart. We will be watching this triangle on Monday evenings trading, moving into Tuesday where we expect a breakout to occur between 1900 hours (GMT) on Monday and 1000 hours Tuesday (GMT) With a buy zone between $910 and $930 pre breakout during the specified times. Stop loss can be placed on the underside of the ascending triangle around $898 and for now we are leaving the profit target OPEN. For shorter term traders you can place your take profit order around $1044 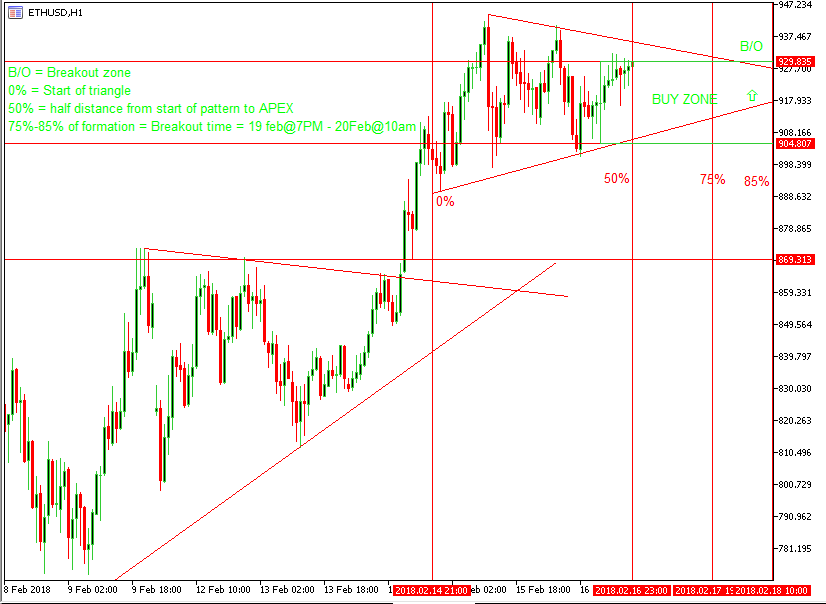 Sam Broye.