SUCCESS STRATEGIES: Trading Crypto's/Equities with Triangle chart patterns.
cryptotrading·@cryptobroye·
0.000 HBDSUCCESS STRATEGIES: Trading Crypto's/Equities with Triangle chart patterns.
Id like to begin, - and continue over the weeks - sharing the strategies that have done me so well, for so long. The patterns I'm about to share with you are timeless. They've been traded for as long as price charts have been around (back in China around the 1920's) It seems natural for us as human beings to complicate absolutely everything. In some fields its a good thing. inventors making more and more complex machines and technology is the reason we are where we are in our world of tech. With a tool for just about everything. It brings new challenges to be overcome, and so we grow, and our intelligence and problem solving skills grow with it. However, when it comes to trading this is unnecessary, not to mention deadly to your career as a trader. I see analysts everywhere attempting to create gigantic, magical, colourful chart patters as if they're trying to duplicate a Monet painting. Trading is as stressful a job as they come, trust me. Why make it harder for yourself by trying to follow, draw and even trade these monstrosities? Your at maximum stress before you even enter a trade let alone trying to manage it when its going against you at that level of stress. Its a recipe for disaster! Fortunately there is a simpler way, and trust me when I say it will change your trading almost over night if you have some patience and master EVEN ONE of these patterns. I will note first, while the patterns can be traded on all time frames, the 1hr/4hr and 1D charts are the most successful by a long shot! The Bull Flag - The Bull Flag is given its name because, well, it looks like a flag. As for the ''Bull'', That's because were looking at it as a bullish (buy) pattern. The first phase the price action will go through will be a rapid steep move up with few to zero retraces. It will most often be a strong move straight up until price comes to a halt, profit taking starts taking place and the price will begin to retrace a small amount and trade sideways. This sideways movement will eventually give a pattern of some kind, and that pattern is more often that not a type of Flag. In the pictures below you can see the most recent example of a Bull flag pattern in creation before the breakout. We actually traded this one and the buy position was called out yesterday in my blog. Today as you can see in fig.3 the pattern broke and price increased 80% in the following few hours! Anatomy of a Bull Flag: - Sharp move up in price. Few-zero retraces showing extreme strength. - Should happen over the space of hours, and over the longer term, days which can be spotted on a weekly chart. Any less than 3-4 hours of upwards movement could be a pump and dump. This is not a flag you want to be buying as it is being manipulated by people with a large market share and you will likely get dumped on. See https://steemit.com/crypto/@cryptobroye/manipulation-vital-information-on-market-movement-and-how-to-read-their-efforts-for-usdprofit for more info - Bull flags break at 75-85% of the move from the beginning of the flag to the Apex, which is known as the part at which the lines cross. Using that figure of 75-85% can help you to pin point a perfect entry. SEE FIG.1 - A break before 75% has an 80% chance of being a FALSE BREAK OUT! This could scare you out. - After 85% the pattern is passed with no break out, it is considered ''BUSTED''. In this scenario the flag becomes un-tradeable and we need to re-analyse the pattern and look for entry. Often after the pattern busts, price will go flat for a mid-long period of time. - Entry will be anywhere inside this bull pattern once it is established. - For a more precise entry, you would buy 50% of your full position inside the flag at around the 75% mark and you would set a buy stop order above the upper side of the bull flag for the second 50% of your positon. - Stop losses would be placed underneath the lower line of the flag. - For entry and stop loss limits see FIG.5 Triangle rules: - ANY TRIANGLE THAT IS FORMED IN AN UPTREND HAS A 75% CHANCE OF BEING A SUCCESSFUL CONTINUATION SIGNAL. THIS IS THE SAME FOR TRIANGLE'S FORMED IN A DOWN-TREND. - ALL TRIANGLES BREAK AT THE SAME 75-85% MARK FROM BEGINNING TO APEX. SEE FIG.1 - TRIANGLES WITH A FLAT TOP/BOTTOM, WILL BREAK THE WAY OF THE FLAT SIDE OF THE TRIANGLE 75% OF THE TIME. FIG.1 Triangle analysis and the 75% rule: Where 0% is considered the beginning of the Triangle, and 100% is considered the apex (where the lines marking the triangle's extremities cross) we can use 75-85% as the time in which we would look to buy. You can buy into a bull flag as soon as you feel it is clearly formed, but the safest entry is to have patience and wait for the 75% mark at least! As you can see, this pattern broke at around the 77% mark! note - If you do not understand, don't hesitate to message me and i will do my best to explain a bit better. - Green arrow = 0% - Red arrow = 100% - Line through the middle, obviously = 50% Break out in this case happens at around 77%. 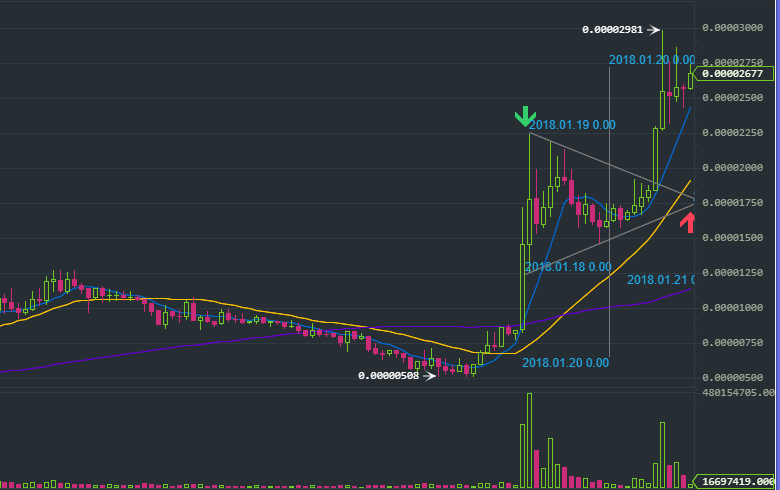 FIG.2 The Bull Flag in the making: 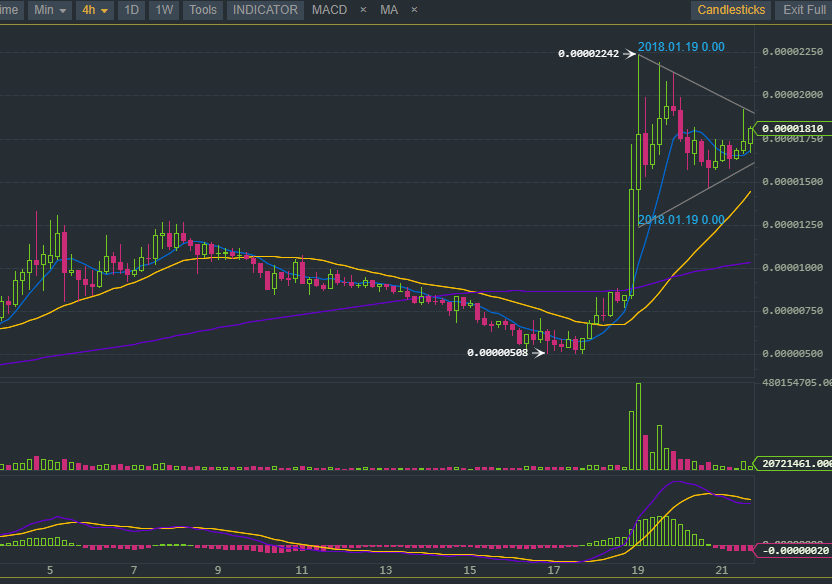 FIG.3 The flag break out at 77% 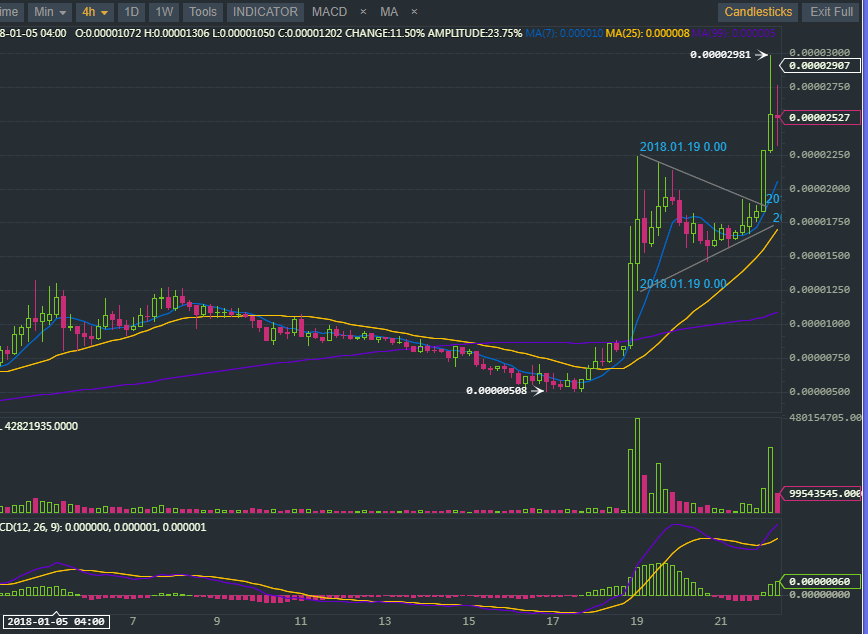 FIG.4 Here is the same Crypto -but on a 2hr chart rather than a 4hr- showing another Bull flag appearing after the previous break. This could be another entry, however, It would be more advised to use this pattern to manage an already open trade. You can use the under side of the bull flag as your new Stop loss position 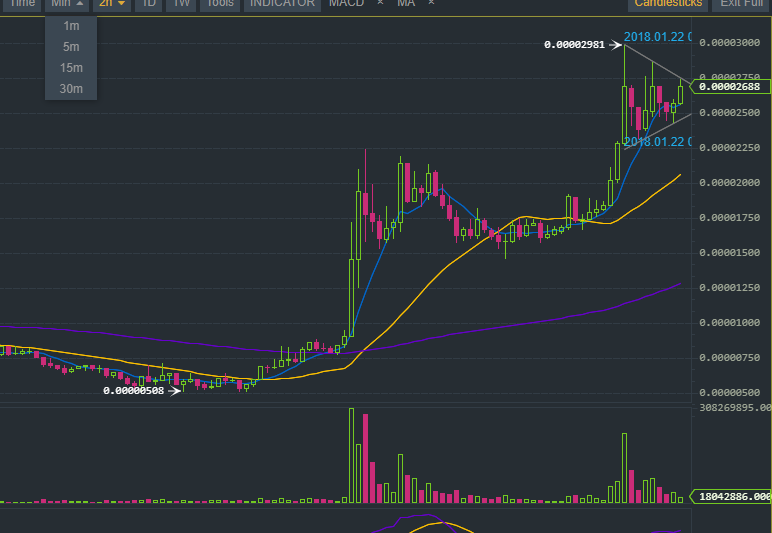 FIG.5 Entry and Stop loss levels - Red up arrow =entry at 75% - Green down arrow points to a box outside of the flags range, which would be a safe zone for Stop loss. - Target/Take profit can be left open until signs of a reversal, or can quite successfully be placed at the same amount of price movement as the initial move. You can see on the charts the second push high was as large as the first and that is common. We put a profit target as the same amount of points as the initial move up into the first flag. 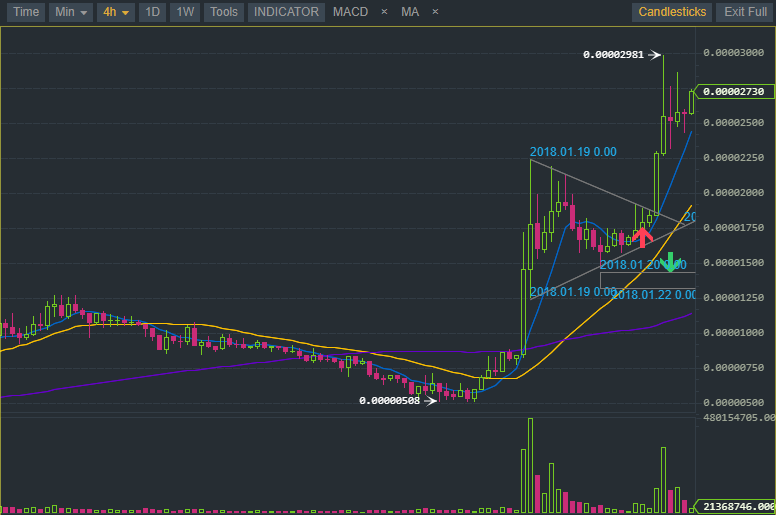 As extensive as this guide to trading triangles is, it is a simple strategy once you get your head around the basics and it doesnt ever get any more complex. It is what it is, a humble 3 sided shape that can quite easily be the difference between continuous loss and simple gains. I hope this post can help you to understand trading triangles and if any one has any questions, Im here to answer them :) Thanks for reading! Sam Broye