Investing Basics: Understanding Candlesticks
money·@cryptomeeks·
0.000 HBDInvesting Basics: Understanding Candlesticks
<h3>If you are going to be spending time watching markets and investing your own money, you need to understand the basics of reading a chart.</h3> <p><h2>Solid Candles</h2></p> <p>Charts can use lines, candles, and multiple other mediums. What the majority of people use is solid and hollow candles.</p> 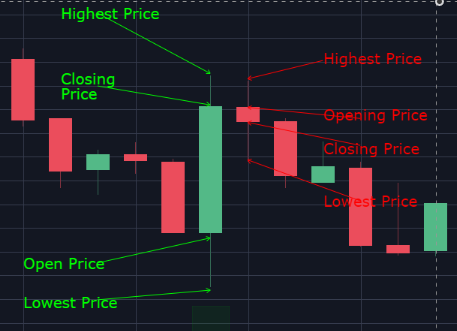 <p> Every candle will have a solid middle section representing the opening and closing price of the candle. If, for that candle, the asset price went in a positive direction, the candle will be green and the top of the thick section will be the closing price and the bottom of it is the opening price. If the asset price went in a negative direction during that candle, the candle will be red and the top of the thick middle section of the candle will be the opening price and the bottom will be the closing price. The thin stick that rises above the main section of the candle represents how far in that direction the asset price went.</p.> <p> Another thing to keep in mind is that candles can represent different time periods. A candle can represent anywhere from 1 minute to 1 month.</p> <p> https://steemitimages.com/DQmVpw1G48Aducu8BzCyAWD8xnBAyDR4CyT6d1rhMMUEgJv/image.png </p> <p>Here we have Litecoin's price action with 1 day candles.</p> <p> https://steemitimages.com/DQmZREjFSvsmUBKZe5UwVPbrTTCKBRgoGxhxRdEwa6aYHo7/image.png </p> <p>Here we have Litecoin with 1 month candles. A little different isn't it?</p> <br><h2>Bars</h2></p> <p>Another way to read charts is by using bars. Bars are very similar to candles, but they may be easier to understand for some people.</p> <p> https://steemitimages.com/DQmawwSGSPtcBnAVSELNfTT45texHD7J3gQiA2XX1ZXLs9B/image.png </p> <br></br> <h2>Thanks for reading! Make sure you like, resteem, and follow!</h2>