Ripple Price Technical Analysis – Can XRP/USD Hold $1.00?
vincentb·@cryptopimp·
0.000 HBDRipple Price Technical Analysis – Can XRP/USD Hold $1.00?
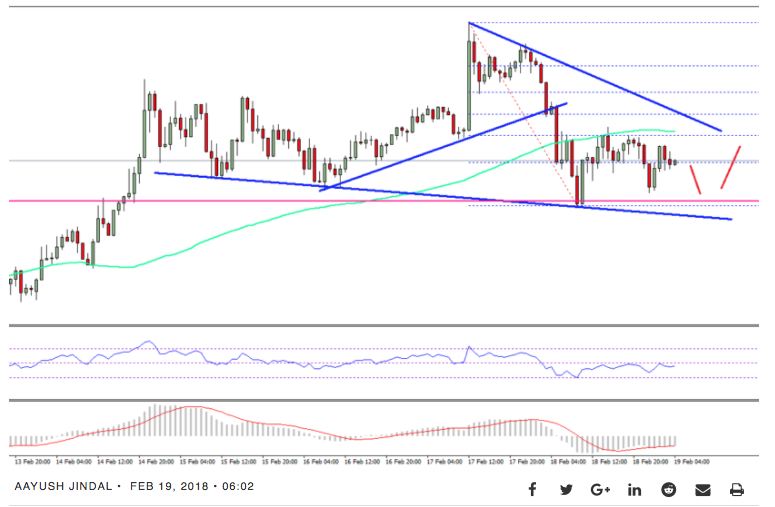 Key Highlights Ripple price after an upside move faced a strong resistance at $1.1500 against the US dollar. There was a break below a connecting bullish trend line with support at $1.0800 on the hourly chart of the XRP/USD pair (data source from SimpleFx). The pair is currently holding the $1.00 support, but it is struggling to move higher. Ripple price made a downside move recently against the US Dollar and Bitcoin. XRP/USD must stay above the $1.0000 support area to avoid further declines. Ripple Price Resistance There was a substantial recovery above $1.10 this past week in Ripple price against the US Dollar. The price traded above the $1.12 and $1.14 level, but it could not break the $1.15 resistance. It formed a high at $1.1508 and later started a downside move. It declined and broke the $1.10 support area to settle below the 100 hourly simple moving average. During the downside, there was a break below a connecting bullish trend line with support at $1.0800 on the hourly chart of the XRP/USD pair. However, the downside move was protected by the $1.0000 support. A low was formed at $1.0055 before the price started an upside correction. It traded above the 23.6% Fib retracement level of the last decline from the 1.1508 high to $1.0055 low. However, the upside move was protected by the $1.06 level and the 100 hourly SMA. On the upside, there is a bearish trend line with resistance at $1.0700 on the same chart 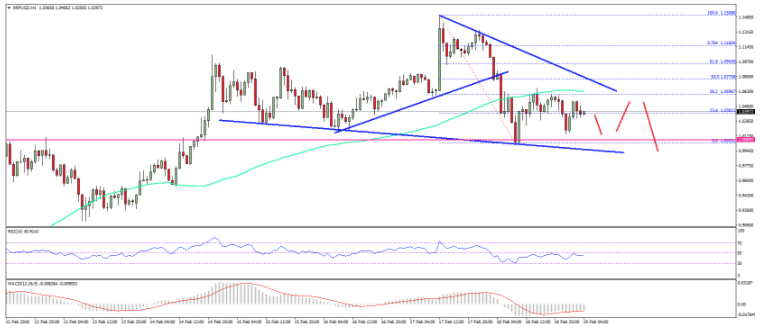 Therefore, an upside move above $1.06 and $1.07 won’t be easy. On the downside, the pair must hold the $1.00 support level to avoid further declines. Below $1.00, the price may decline towards $0.8500 in the near term. Looking at the technical indicators: Hourly MACD – The MACD for XRP/USD is currently in the bearish zone. Hourly RSI (Relative Strength Index) – The RSI for XRP/USD is currently well below the 50 level. Major Support Level – $1.0000 Major Resistance Level – $1.0700
👍 cryptopimp, resteem.bot, bobsthinking, jankeman, mahfu, mariannymedina, emanuelmedina, damienlu, dijah, ikbal1, denisfair, msyoung, davidfumo, businesswri, gtg, coin.info, alphacore, cryptoconnector, amicus, grandpawhale, npl77, aaronleang, samstickkz, soyrosa, dexter-k, timmylace, aghunter, tesaganewton, suggeelson, irfanullah, kendewitt, arunava, intuitivejakob, zinovi, paced.financial, kiraxoy, duckmast3r, tagsplanet,