BTC price Prediction - Feb 23 2018 - توقعات سعر البيتكوين فبراير ٢٠١٨
bitcoin·@cryptospective·
0.000 HBDBTC price Prediction - Feb 23 2018 - توقعات سعر البيتكوين فبراير ٢٠١٨
The bigger Picture: On the daily BTC/USDT chart, it is obvious that the BTC price is still in a downward trend within a clear channel (purple shaded area), A strong resistance level occurred at 11,700 level before price started going back down creating a 3rd touch along the same channel trendline. In addition, The stochastic RSI indicator shows that Moving averages of Stochastic are crossing from overbought to no man's zone, this is a strong indicator that the price is going back down UNLESS it closes again above 10,400 level on the daily chart and then above 11,700 on the same chart. 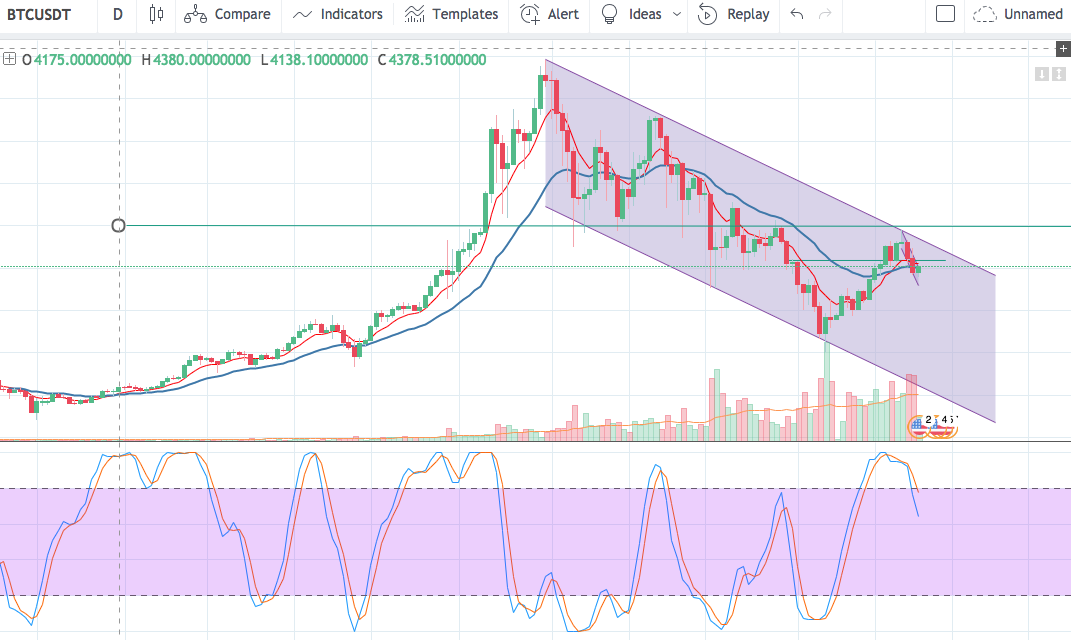 On the hourly, chart, the same pattern is occurring, tells us that the hourly chart is following the daily chart and further indicates that the price will possibly keep going down. RSI also shows that price is at overbought zone and will sooner or later cross down to the " no man's zone" and sell off. 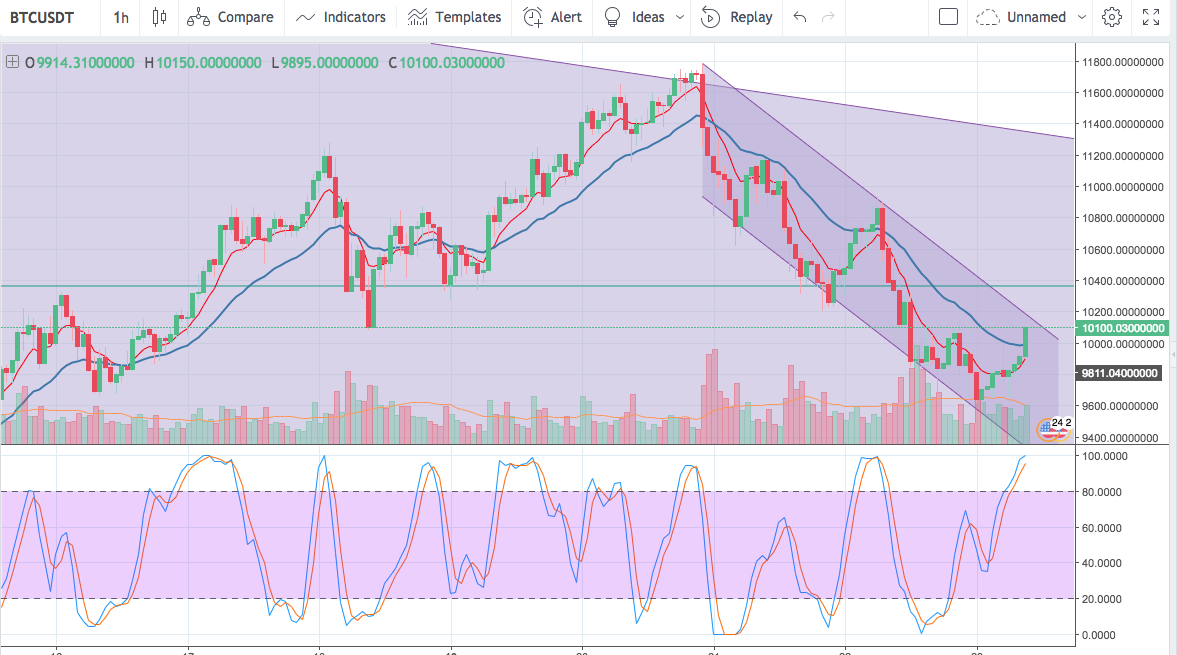 Conclusion: Unless Price closes above 10,400 on the daily chart, and then closes above 11,700 on the same chart, we can expect BTC price to drop back to 7000 level or even lower before it starts taking off again. I repeat, if price closes above 10,400 and 11,700 respectively, then the downtrend is broken and we may see BTC rising up again, but for the meantime, odds are higher for a price drop. Technical Analysis by : Tarek S Co-Founder @Cryptospective Community