I wrote this simple R script to keep track of crypto portfolio and evaluate realtime portfolio worth in any fiat or crypto
programming·@cryptovest·
0.000 HBDI wrote this simple R script to keep track of crypto portfolio and evaluate realtime portfolio worth in any fiat or crypto
Script is [here](https://github.com/cryptovest/portfolio/blob/master/portfolio.R).
This is a simple R script to keep track of crypto investment. The script enables user to record and track investments with two functions:
```
add_trade()
```
with which user can record transactions, *e.g.*, deposit, withdraw or exchange. And
```
portfolio_value()
```
which evaluates real time portfolio value in user specified crypto or fiat currency. We'll create a function to make naive price prediction as well as the two functions mentioned.
First, check if required packages are installed. If not, install them:
```
if (!require("jsonlite")) install.packages("jsonlite")
if (!require("dplyr")) install.packages("dplyr")
if (!require("ggplot2")) install.packages("ggplot2")
if (!require("forecast")) install.packages("forecast")
if (!require("plotrix")) install.packages("plotrix")
```
It's a good practice save trade history in disk. We'll save it as .csv file which allows analysis using other software as well. The below code chunk checks if there's a file named `trade_histoy.csv` in user's working directory. If not, the code will create one. Issue ```getwd()``` to see current working directory and ```setwd(<directory path>)``` to set working directory.
```
if(!file.exists("trade_history.csv")){
trade_history <- data.frame(type=factor(levels = c("deposit", "wtihdraw", "exchange")),
deposit_amount=double(),
deposit_currency=factor(),
withdraw_amount=double(),
withdraw_currency=factor(),
exchange_name=character(),
remark=character(),
date=character(), # year-month-day format eg 2017-07-18
stringsAsFactors=FALSE)
write.csv(x = trade_history, file = "trade_history.csv", sep = ",", row.names = FALSE)
}
```
We inspect what our old or newly created *trade_history.csv* contains. First load the data with ```read.csv()``` function, store that data in an R variable named ```trade_history``` and see top few rows of that R variable with ```head(trade_history```:
```
trade_history <- read.csv(file = "trade_history.csv", header = TRUE, sep = ",")
head(trade_history)
```
Output of ```head(trade_history)``` is:
```
[1] type deposit_amount deposit_currency withdraw_amount withdraw_currency exchange_name remark date
<0 rows> (or 0-length row.names)
```
Since we haven't yet entered any trade/transaction, it's a dataset with 0 rows. Lets create the function named ```add_trade()``` so we can add transactions easier:
```
add_trade <- function(type, deposit_amount = 0, deposit_currency = NA,
withdraw_amount = 0, withdraw_currency = NA, exchange_name = NA,
remark = NA, date = NA) {
new_trade <- data.frame(type, deposit_amount, deposit_currency,
withdraw_amount, withdraw_currency, exchange_name, remark, date)
read.csv(file = "trade_history.csv", header = TRUE, sep = ",") %>%
rbind(new_trade) -> "trade_history"
write.csv(x = trade_history, file = "trade_history.csv", sep = ",", row.names = FALSE)
assign(x = "trade_history", trade_history, envir = globalenv())
}
```
Now add a few transactions with the function ```add_trade()``` we just created:
```
add_trade(type = "deposit", deposit_amount = 0.2, deposit_currency = "BTC", remark = "gift from brother", date = "2017-07-01")
add_trade(type = "deposit", deposit_amount = 5, deposit_currency = "XMR", remark = "purchased", exchange_name = "poloniex", date = "2017-07-02")
add_trade(type = "deposit", deposit_amount = 1, deposit_currency = "ETH", remark = "mining reward", date = "2017-07-05")
add_trade(type = "deposit", deposit_amount = 200, deposit_currency = "STEEM", remark = "Steemit rewarrd", date = "2017-07-06")
add_trade(type = "trade", deposit_amount = 1.1, deposit_currency = "ZEC", withdraw_amount = 0.1, withdraw_currency = "BTC", remark = "Exchanged BTC for ZEC", date = "2017-07-09")
add_trade(type = "trade", deposit_amount = 4.6, deposit_currency = "ETC", withdraw_amount = 2, withdraw_currency = "XMR", remark = "Exchanged XMR ETC", date = "2017-07-10")
add_trade(type = "trade", deposit_amount = 65, deposit_currency = "EOS", withdraw_amount = 0.5, withdraw_currency = "ETH", date = "2017-07-14")
add_trade(type = "withdraw", withdraw_amount = 0.5, withdraw_currency = "XMR", remark = "lost wallet key")
```
See our first 5 transactions (rows) of trade history by running ```head(trade_history, 8)```
```
type deposit_amount deposit_currency withdraw_amount withdraw_currency exchange_name remark date
1 deposit 0.2 BTC 0.0 <NA> <NA> gift from brother 2017-07-01
2 deposit 5.0 XMR 0.0 <NA> poloniex purchased 2017-07-02
3 deposit 1.0 ETH 0.0 <NA> <NA> mining reward 2017-07-05
4 deposit 200.0 STEEM 0.0 <NA> <NA> Steemit rewarrd 2017-07-06
5 trade 1.1 ZEC 0.1 BTC <NA> Exchanged BTC for ZEC 2017-07-09
```
Note that we don't need to supply values for all the arguments. Empty argument values default to `NA`. This, however, doesn't provide compact info about our portfolio. Let's create a function and name it ```portfolio()``` that will:
```
portfolio <- function() {
deposit <- aggregate(trade_history[c("deposit_amount")],
by = trade_history[c("deposit_currency")], FUN=sum)
names(deposit) <- c("currency", "deposit_amount")
withdraw <- aggregate(trade_history[c("withdraw_amount")],
by = trade_history[c("withdraw_currency")], FUN=sum)
names(withdraw) <- c("currency", "withdraw_amount")
portfolio <- full_join(x = deposit, y = withdraw, by = "currency")
portfolio[is.na(portfolio)] <- 0
portfolio$available <- portfolio$deposit_amount - portfolio$withdraw_amount
assign(x = "portfolio", portfolio, envir = globalenv())
print(portfolio)
}
```
Unlike ```add_trade()```, this ```portfolio()``` function doesn't take any argument. Just issue ```portfolio()``` which in our case returns a compact table:
```
currency deposit_amount withdraw_amount available
1 BTC 0.2 0.1 0.1
2 EOS 65.0 0.0 65.0
3 ETC 4.6 0.0 4.6
4 ETH 1.0 0.5 0.5
5 STEEM 200.0 0.0 200.0
6 XMR 5.0 2.5 2.5
7 ZEC 1.1 0.0 1.1
```
If were to know how much the portfolio is worth in, say, USD, EUR, CNY or BTC? Let's create a function ```portfolio_value()``` that will do our job:
```
portfolio_value <- function(priced_in) {
for(i in 1:nrow(portfolio)) {
url <- paste0("https://min-api.cryptocompare.com/data/price?fsym=", portfolio[i, 1], "&tsyms=", priced_in, collapse = "")
unit_price <- fromJSON(url)[[1]]
portfolio$value[i] <- unit_price * portfolio$available[i]
}
assign(x = "portfolio_value", portfolio, envir = globalenv())
print(portfolio_value)
print(paste("Total portfolio value in", priced_in, sum(portfolio_value$value)))
lbls <- paste0(portfolio$currency, " : ", # Create labels for plot
sprintf("%.2f", (portfolio$value / sum (portfolio$value))*100), "%")
pie3D(portfolio$value, labels = lbls,
explode=0.1, main="Portfolio value")
}
```
The ```portfolio_value()``` function takes one argument - the currency in which we want to evaluate our portfolio. Standard symbols are accepted like, USD, EUR, BTC, ETH. I would like to know how much it's worth in Chinese Yuan symbled CNY:
So I execute ```portfolio_value("CNY")``` which returns the below table as well as the pie chart:
```
currency deposit_amount withdraw_amount available value
1 BTC 0.2 0.1 0.1 1585.070
2 EOS 65.0 0.0 65.0 729.950
3 ETC 4.6 0.0 4.6 491.418
4 ETH 1.0 0.5 0.5 767.625
5 STEEM 200.0 0.0 200.0 1724.000
6 XMR 5.0 2.5 2.5 620.150
7 ZEC 1.1 0.0 1.1 1466.366
[1] "Total portfolio value in CNY 7384.579"
```
<br>
<center>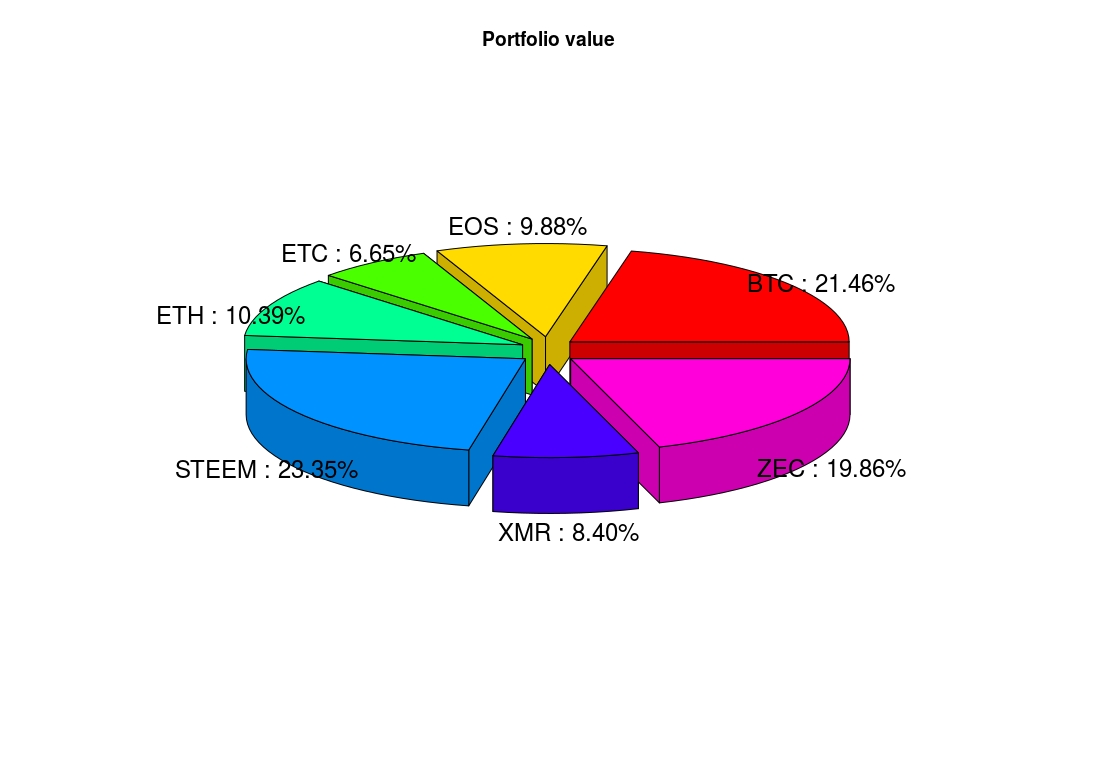</center>
We might be interested in some predictive analysis of portfolio performance. Let's see how we can make prediction using simple method. I would like to know how BTC is going to perform in the next 30 days against USD. Let's create a function so we can do same thing for all currencies:
```
predict_currency <- function(currency, priced_in, period) {
url <- paste0("https://min-api.cryptocompare.com/data/histoday?fsym=", currency, "&tsym=", priced_in, "&allData=true", collapse = "")
histoday <- fromJSON(url)
ts <- ts(histoday$Data$close, start = histoday$Data$time[1])
fit_arima <- auto.arima(ts)
autoplot(forecast(fit_arima, period))
}
```
Now run ```predict_currency("BTC", "USD", 30)```. It generates the below graph in which colored region indicates the likely price of BTC in USD in the next 30 days:
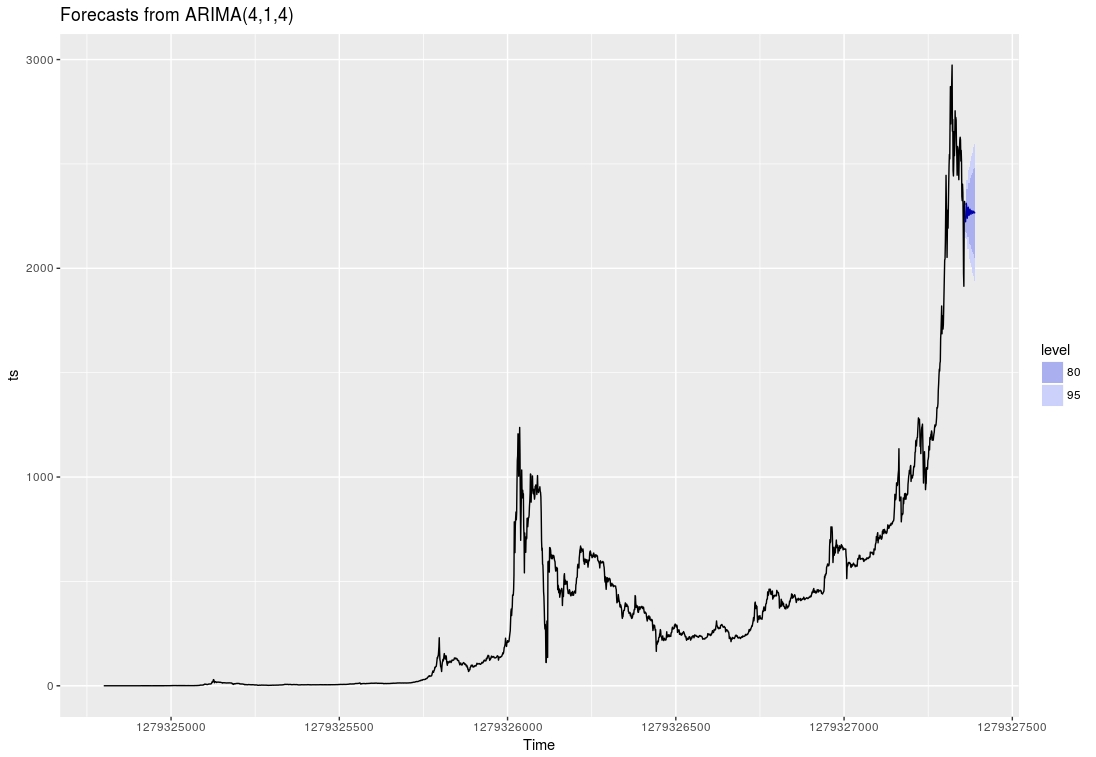
Run for, example, ```predict currency("ETH", "BTC", 7)``` to get estimated ETH price in BTC for the next 7 days. It would be nice to create a predictive function for our portfolio like:
```
predict_portfolio <- fuction (period) {
# do things
}
```
We'll do this in the next post.
I just uploaded the script in my [git repo](https://github.com/cryptovest/portfolio). Feel free to contribute and provide suggestion to improve code so it can be actually be used by others. Thanks!