BITCOIN - 7/13/2017 Price Update
bitcoin·@custommachine·
0.000 HBDBITCOIN - 7/13/2017 Price Update
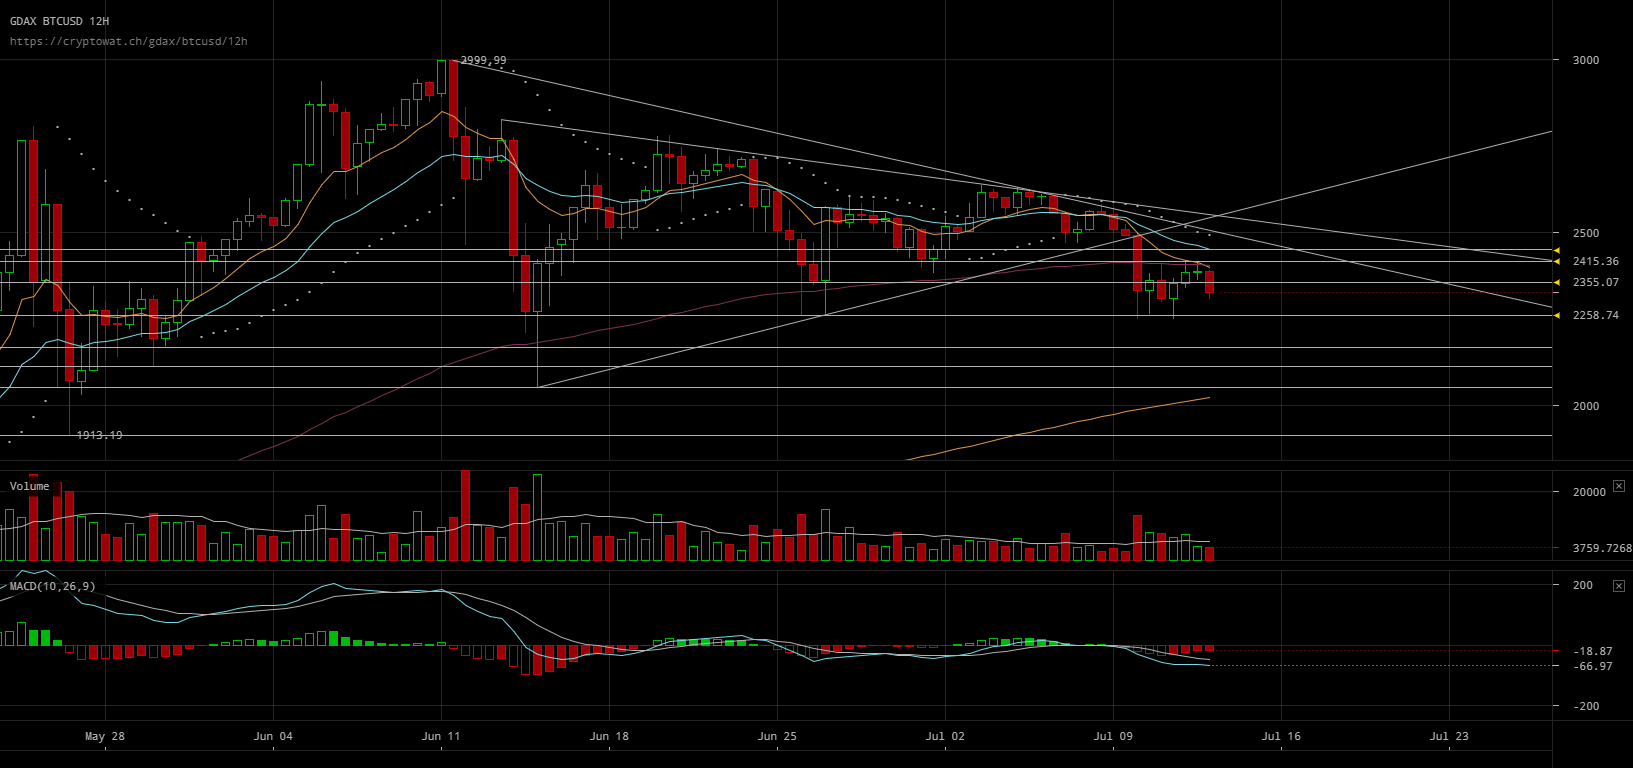 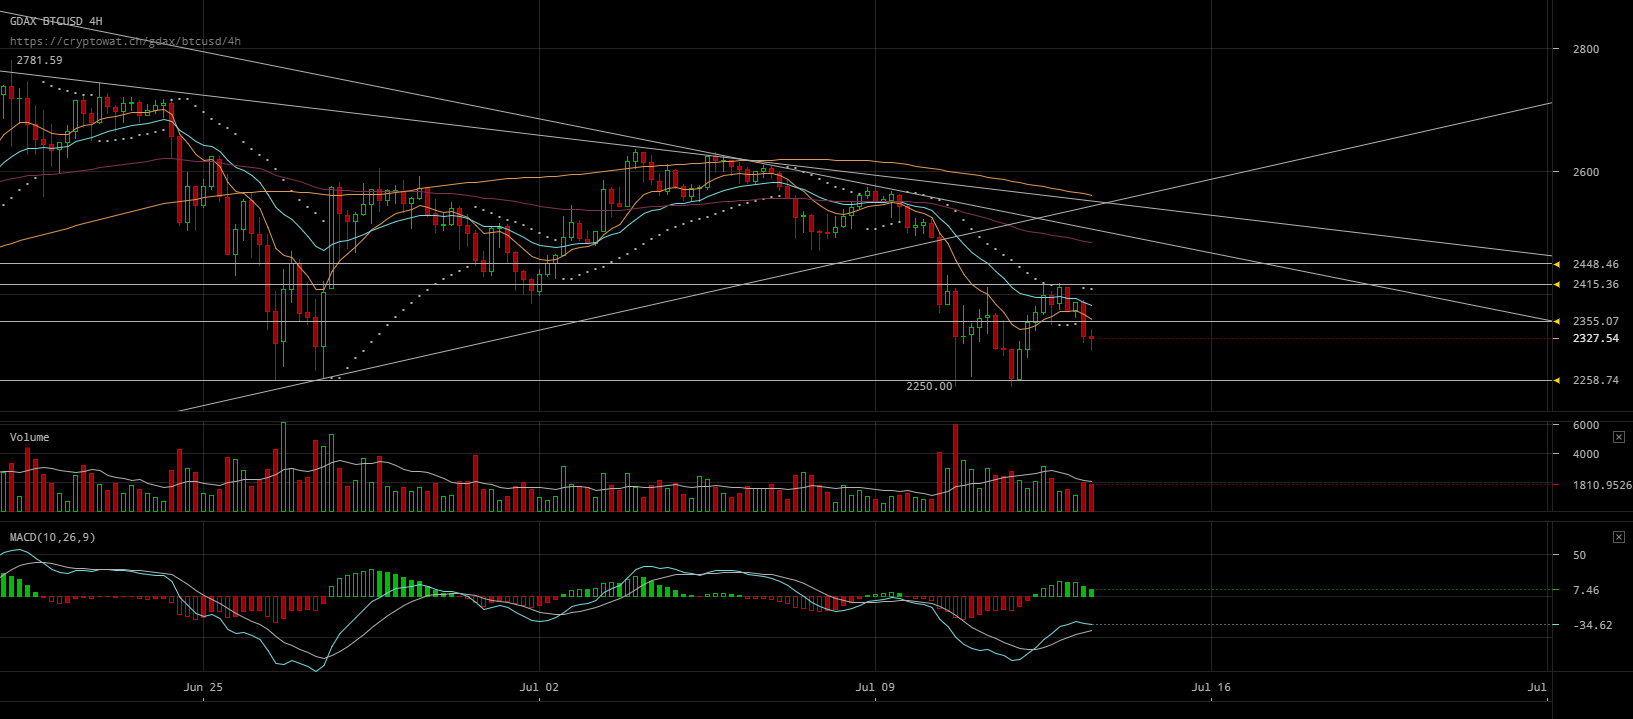 Bitcoin remains in a sideways trend even after falling out of the equilateral triangle on the 10th. It has found major support the past month at $2258 and seems to want to stay above it. Nothing about these charts leads me to believe Bitcoin wants to go lower like Ethereum has. It seems to be in a holding pattern. Perhaps the August 1st event will provide direction? Levels to watch the next 12-24 hours: -$2475: The equilateral triangle top trend line -$2448: 2nd level overhead resistance -$2415: 1st level overhead resistance -$2355 Acting as both resistance and support recently. Definitely the level to watch a fight over. -$2327: Current price -$2258: Major support and perhaps it will test this again soon. If it breaks this then the sideways price action prediction will fall apart.