Stock to flow 120724
bitcoin·@darkflame·
0.000 HBDStock to flow 120724
<center> How many days are remaining until the next halving? 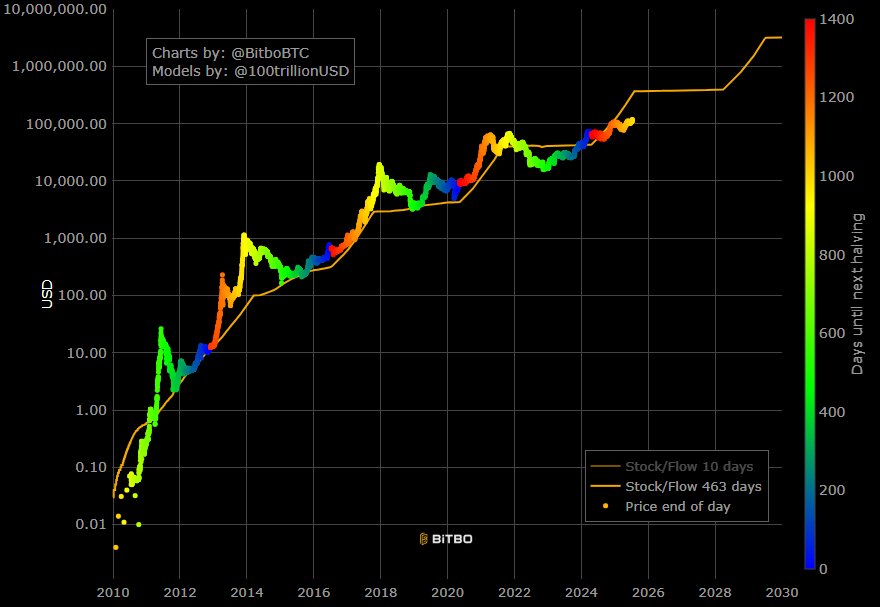 https://charts.bitbo.io/stock-to-flow/ # 1005 Days remain until the '3.125 coins per block' reward decreases to 1.5625 coins. 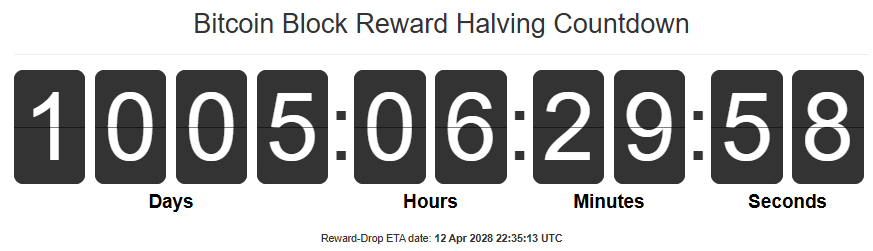 https://www.bitcoinblockhalf.com/ > Total Bitcoins left to mine: 1,108,622 Total Bitcoins left to mine until next blockhalf: 452,372 ### 40% of the coins remaining to be mined, will be created by April 12th 2028. This is the final countdown!  Using the color gradient I can identify approximately where in the cycle BTC is.  How low can the price of BTC go right now? During the last two cycles, the price continued to rise. 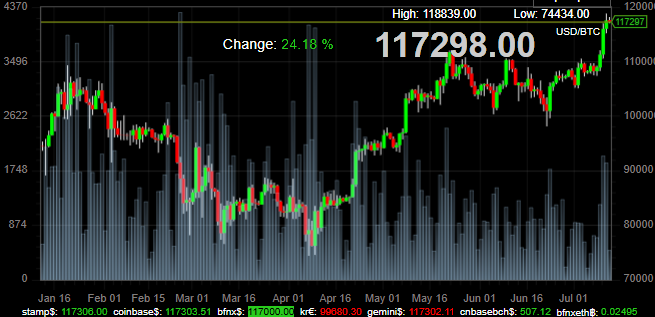 https://bitcointicker.co/stamp/btc/usd/6Mth/ 6 month low: $74,434 USD. 6 month high: $118,839 USD  Proverbs 21:5: "The plans of the diligent lead to profit as surely as haste leads to poverty." #### Ecclesiastes 3:1, 6: "To everything there is a season, and a time to every purpose under the heaven... a time to keep, and a time to throw away."  Ok grandpa, back in your day there wasn't $108 Trillion dollars. 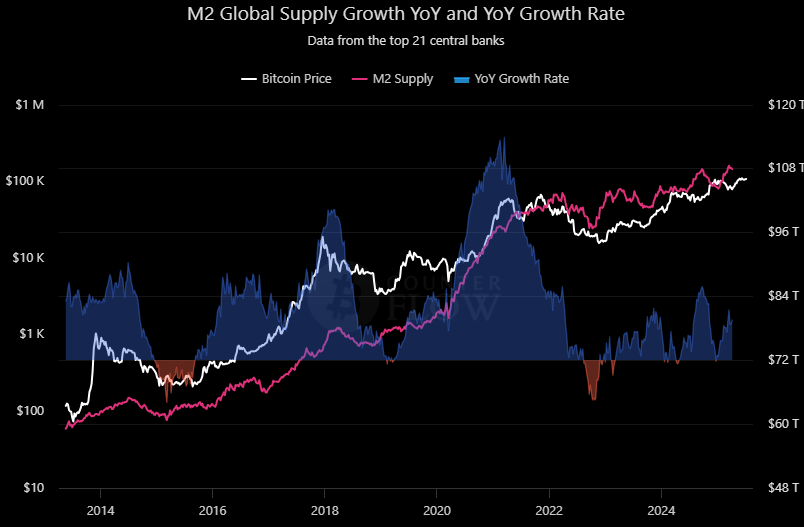 https://bitcoincounterflow.com/charts/m2-global/ ### As long as global M2 continues to expand, Bitcoin will likely rise and fall in its cycles, accumulating more and more market cap. > Claude: 'The statement is well-supported by empirical data and analysis: Bitcoin’s market cycles and long-term market cap growth have shown a strong, though not absolute, correlation with the expansion of global M2 money supply'*P 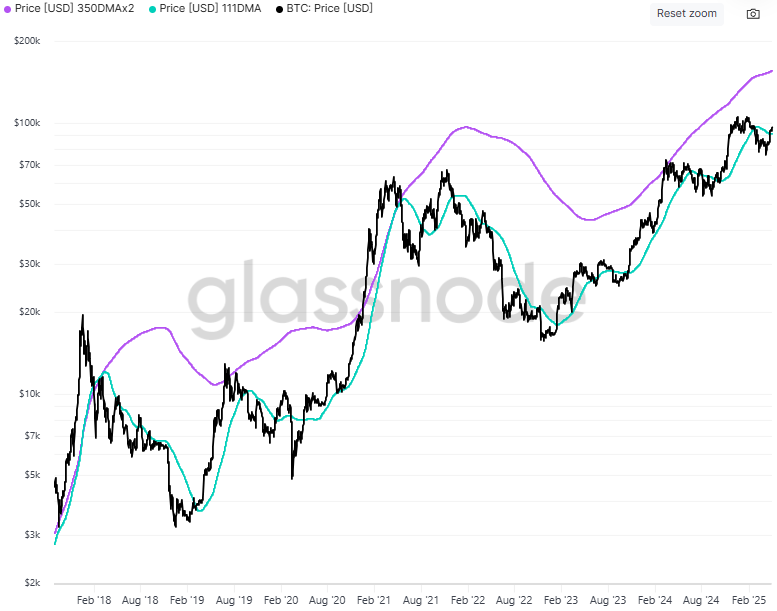 <a href="https://studio.glassnode.com/charts/indicators.PiCycleTop?s=1504137600&u=1746014400&zoom=">BTC: Pi Cycle Top Indicator</a> > "The Pi Cycle indicators is composed of the 111 day moving average (111SMA) and a 2x multiple of the 350 day moving average (350SMA x 2) of the asset's price. This metric shows when an asset becomes significantly overheated (the shorter MA reaches the levels of the larger MA), and has historically been a good indicator for cycle tops. This metric was first put forward by Philip Swift."  # Today's Mayer Multiple: 1.21 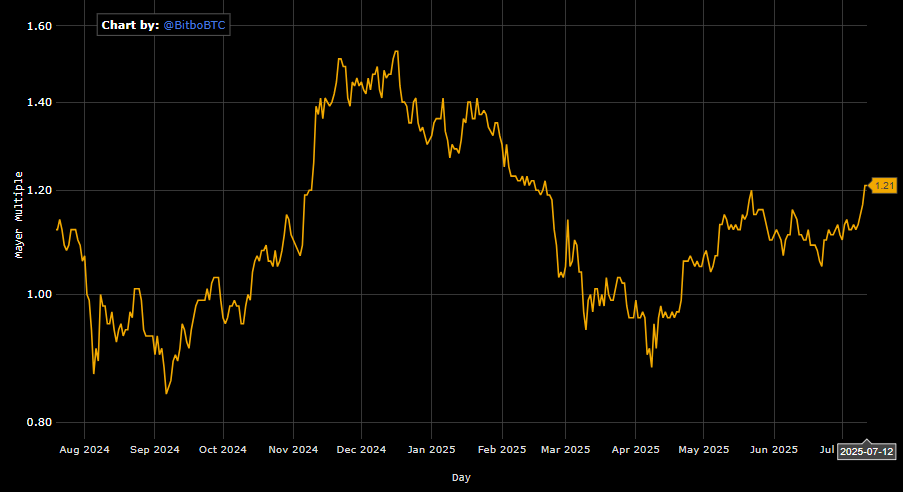 > "The Mayer Multiple is the multiple of the current Bitcoin price over the 200-day moving average. Why 2.4? Simulations performed by Trace Mayer determined that in the past, **the best long-term result were achieved by accumulating Bitcoin whenever the Mayer Multiple was below 2.4.**" Finally, this final chart shows what could happen if this cycle repeats. 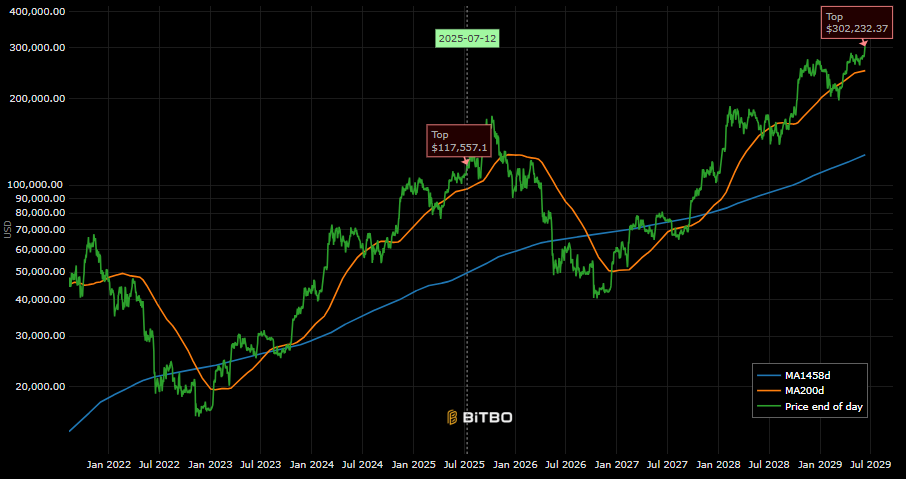 https://charts.bitbo.io/cycle-repeat/ This is NOT a prediction, just a model, which suggests BTC could reach $302,232 USD by June 12th 2029, <u>if this cycle repeats exactly</u> (which it wont). It does however give us some perspective about the direction the BTC price could go over the next 4 years.  #### Do your own research! *This is not financial advice, just observations over time.* Don't buy BTC unless you can afford to lose it. ----------------- @Darkflame </center>
👍 darkflame, condigital, zuun.net, neoxianvoter, freebornsociety, sciencevienna, mochita, yourfuture, isnochys, glimpsytips.dex, darkpylon, rar3cardz, steem-holder, sidekicker2, pixelfan, neoxvoter, sambapools, nave7, magic.pepe, fat-elvis, trezzahn, mirroredspork, lolz.meme, steemulant, pocketjs, steemtelly, pof.meme, kerrislravenhill, tokenpimp, athunderstruck, pimptoken, pimp.token, pimpdistrict, thepimpdistrict, ydaiznfts, dibblers.dabs, thecryptopimp, biglove, blockchainyouth, hivehustlers, joeyarnoldvn, mytechtrail, russellstockley, jglake, maddogmike, thepeakstudio, kam5iz, slothlydoesit, slothbuzz, holovision, memehive,