Visualizing Algorithms in d3.js
algorithms·@datatreemap·
0.000 HBDVisualizing Algorithms in d3.js
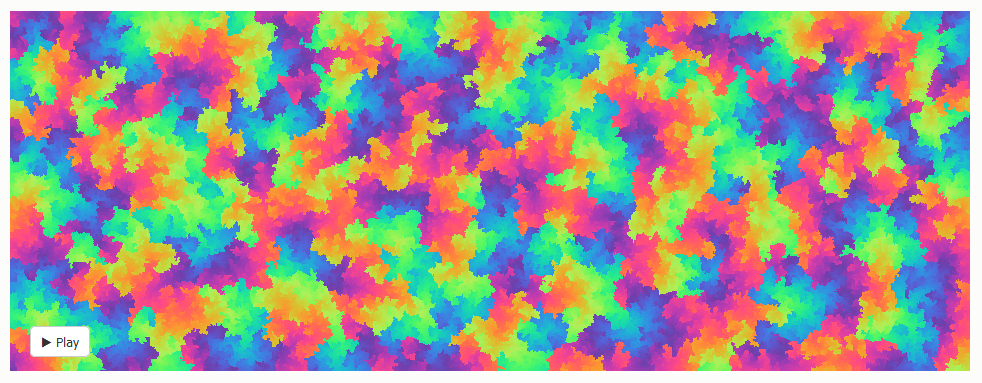
A great resource for visualizing the steps an algorithm takes for solving a certain task is the following https://bost.ocks.org/mike/algorithms/ page of Mike Bostock. There you can see how to visualize algorithms by using the d3.js library. The github repo can be seen here https://gist.github.com/mbostock An example of algorithm visualized is "Randomized depth-first traversal" for tree searching as you can see below. It seems like a form of graphical art!  There are many more examples of algorithms visualized such as sorting or shuffeling in the Mike's site so have a look, it is definitely worth the time.