Counting Colors
bitcoin·@doctorjohn·
0.000 HBDCounting Colors
When looking at financial charts, my favorite is a daily bar chart. Frequently these daily actions are colored green if the price action is positive and red if the price action is negative. By simply counting the number of consecutive colored bars, it is possible to anticipate an upcoming change in direction.  This is not really technical analysis. It is a personal observation technique. Below is the current chart for Bitcoin: 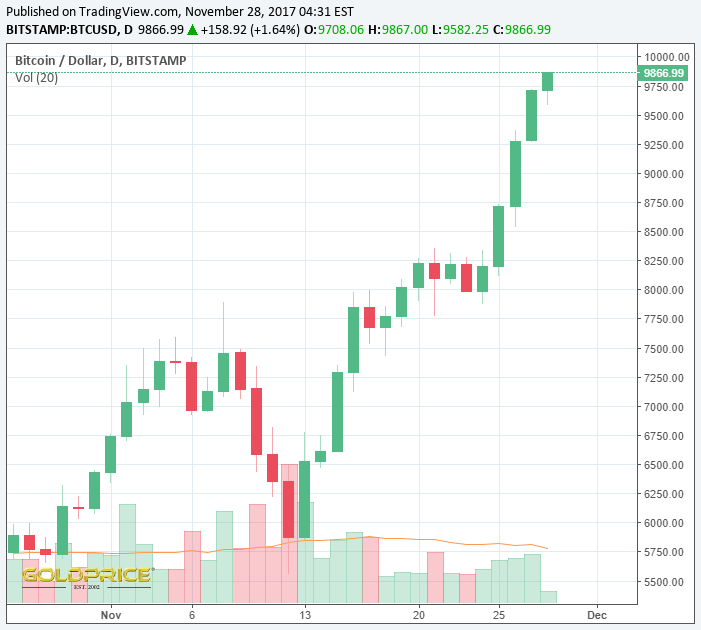 Notice we are in the fifth consecutive green day. We are also very near an emotional level of resistance level of 10,000. Do you sense the need for a red bar or two? We are also approaching Christmas. Tommy wants a new drone hovering toy. I think people everywhere will take some profits. This profit taking might cause a few consecutive red days. Like I said, this is not 'technical' analysis. Yesterday I sold a bit too early. Does that make me a leading indicator? It is fun to watch, learn and play. I saw last evening that Greg Mannarino closed his entire Bitcoin position for a short time. He is a professional trader. His insight is much more developed. You can follow him at @marketreport Here is today's beauty.