DOW update 04.02.18
dow·@ew-and-patterns·
0.000 HBDDOW update 04.02.18
## When you see a huge red weekly candle after a parabolic 10,000P rally, you should expect the worst. There is no guarantee that this will start a multi month correction in the DOW, but the potential is there. ## In my last post I expected a 1400P correction in total to be approaching soon. Now we nearly had that already within just one weekly candle. Do I need to tell you that this is bad? 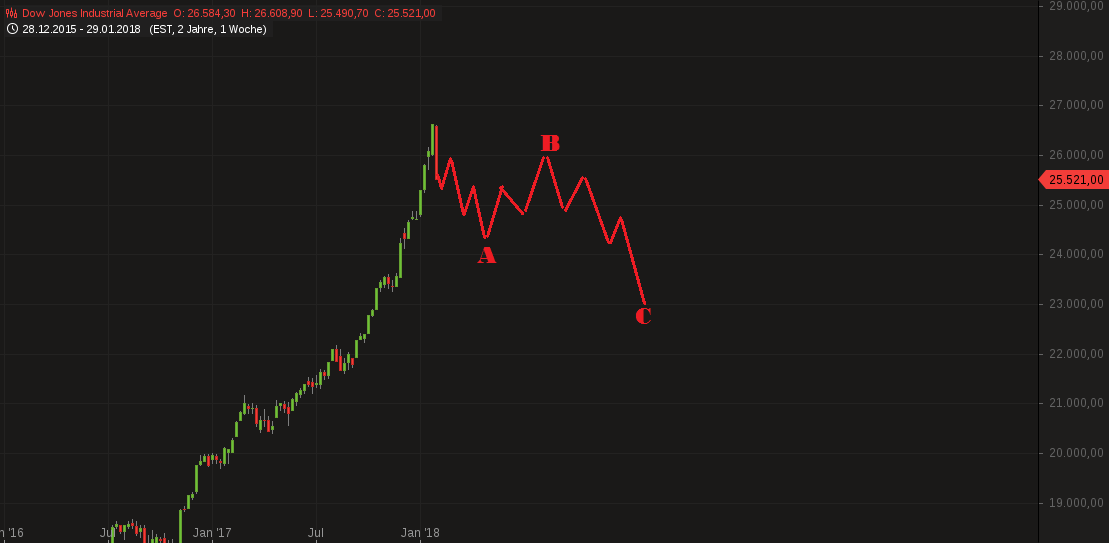 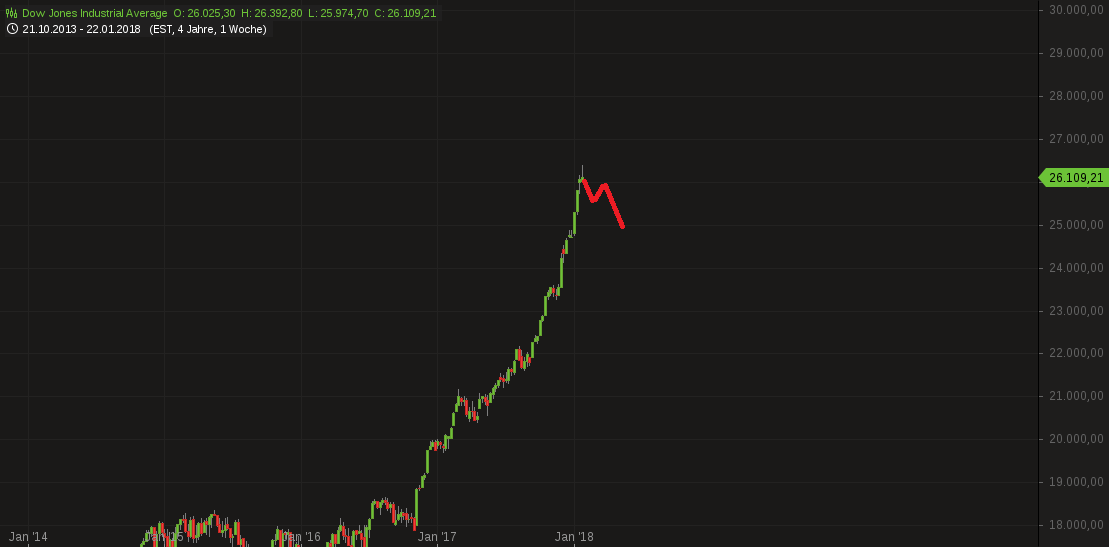 ## The scenario I am pointing out here is not trying to be accurate in time consumption or price levels. In this case it is only a depiction of what to expect, after such a prolonged rally. The scenario could be less worse or much worse than shown in this picture. I will not be able to make a good prediction until wave A is done and wave B has started. ## I don't want to scare you yet, but if this turnes out to be a big correction, It could last the whole year 2018 or even longer... ## I am going to keep a close eye on this one, because a big wave C is usually where I am at my best performance. The best case scenario for me would be to short the DOW for 4000P in wave C. That would be super awesome. .png) If you think this to be useful information:  .png) Feel free to use and share my charts, but please mention me, @ew-and-patterns as the author. Otherwise it is considered plagiarism and I will flag you and advise my friends to do the same. .png) MUST READ! DISCLAIMER: This post / analysis serves general information purposes only. I am not, and never will be a financial adviser. The material in this post does not constitute any trading advice whatsoever. This is just the way I see the charts and what my trading ideas (from my personal experiences) are. I use chart pattern and Elliott Wave analysis for my trading ideas. For full disclosure: The author of this post is holding positions in this market at the time of this post. Please conduct your own due diligence, if you plan to copy anyones investment decisions! If you make any trades or investments after reading this post, it is completely in your own responsibility. I am not responsible for any of your losses. By reading this post you acknowledge and accept to never hold me accountable for any of your losses. Please consider leaving a comment, like or resteem, if this post entertained you or helped you see things differently... Have a nice day :-)
👍 ew-and-patterns, soydandan, mahdihawkeye, cryptoscout, sciphor, etherial, princluv, robertdowney, jack353, sbi2, olayar, fresh-meme-dream, crypto-pontiff, toofasteddie, michaeldavid, arunava, bonjovis, number-station, aiyeecanoy, neonartist, worldclassplayer, dexter-k, bonv, muhammadiksan, oksanakazakova, tabzjones, allyouneedtoknow, fazzaa, itadakimasu, eikejanssen, danyelk, drifter1, justdentist, swagtoshi, medicinaenvideo, pinkjasmine, lichtblick, welovesteemit, kywt, sn1p3r, munawar1235, zakir43, rocky1, aledo, gandalf123,