BITCOIN Signs That High Is In -- Support Tests Coming
bitcoin·@exxodus·
0.000 HBDBITCOIN Signs That High Is In -- Support Tests Coming
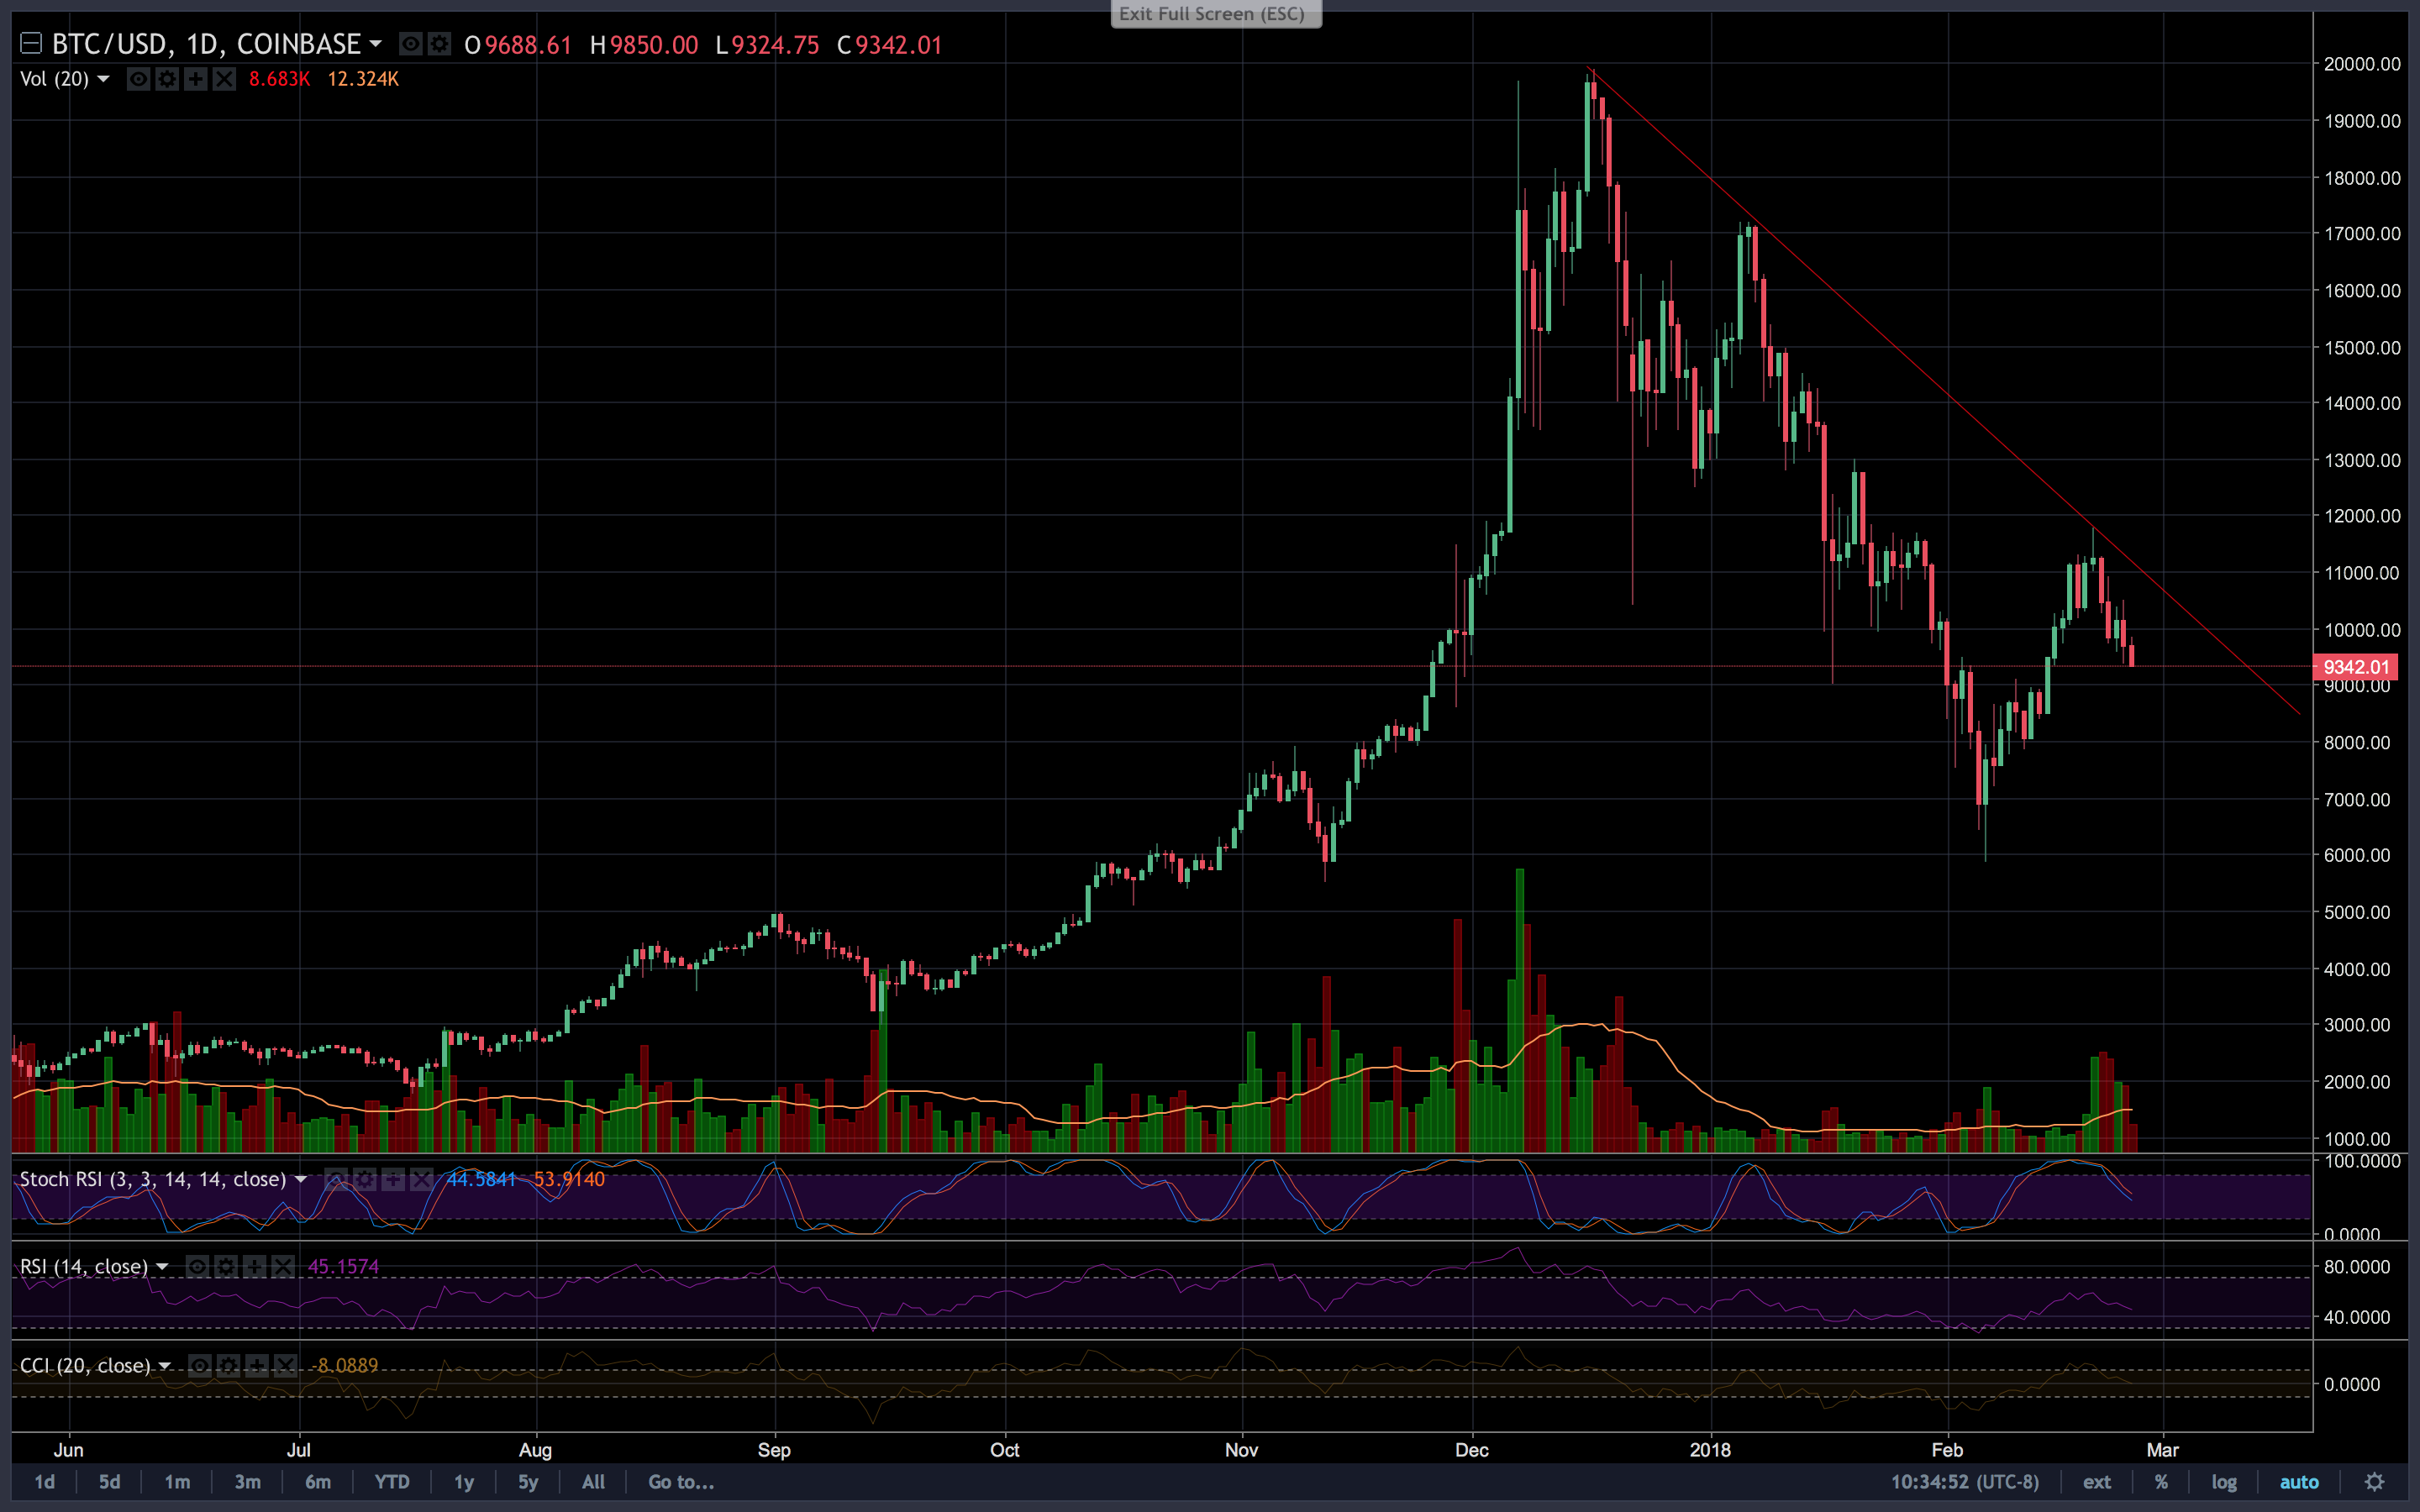
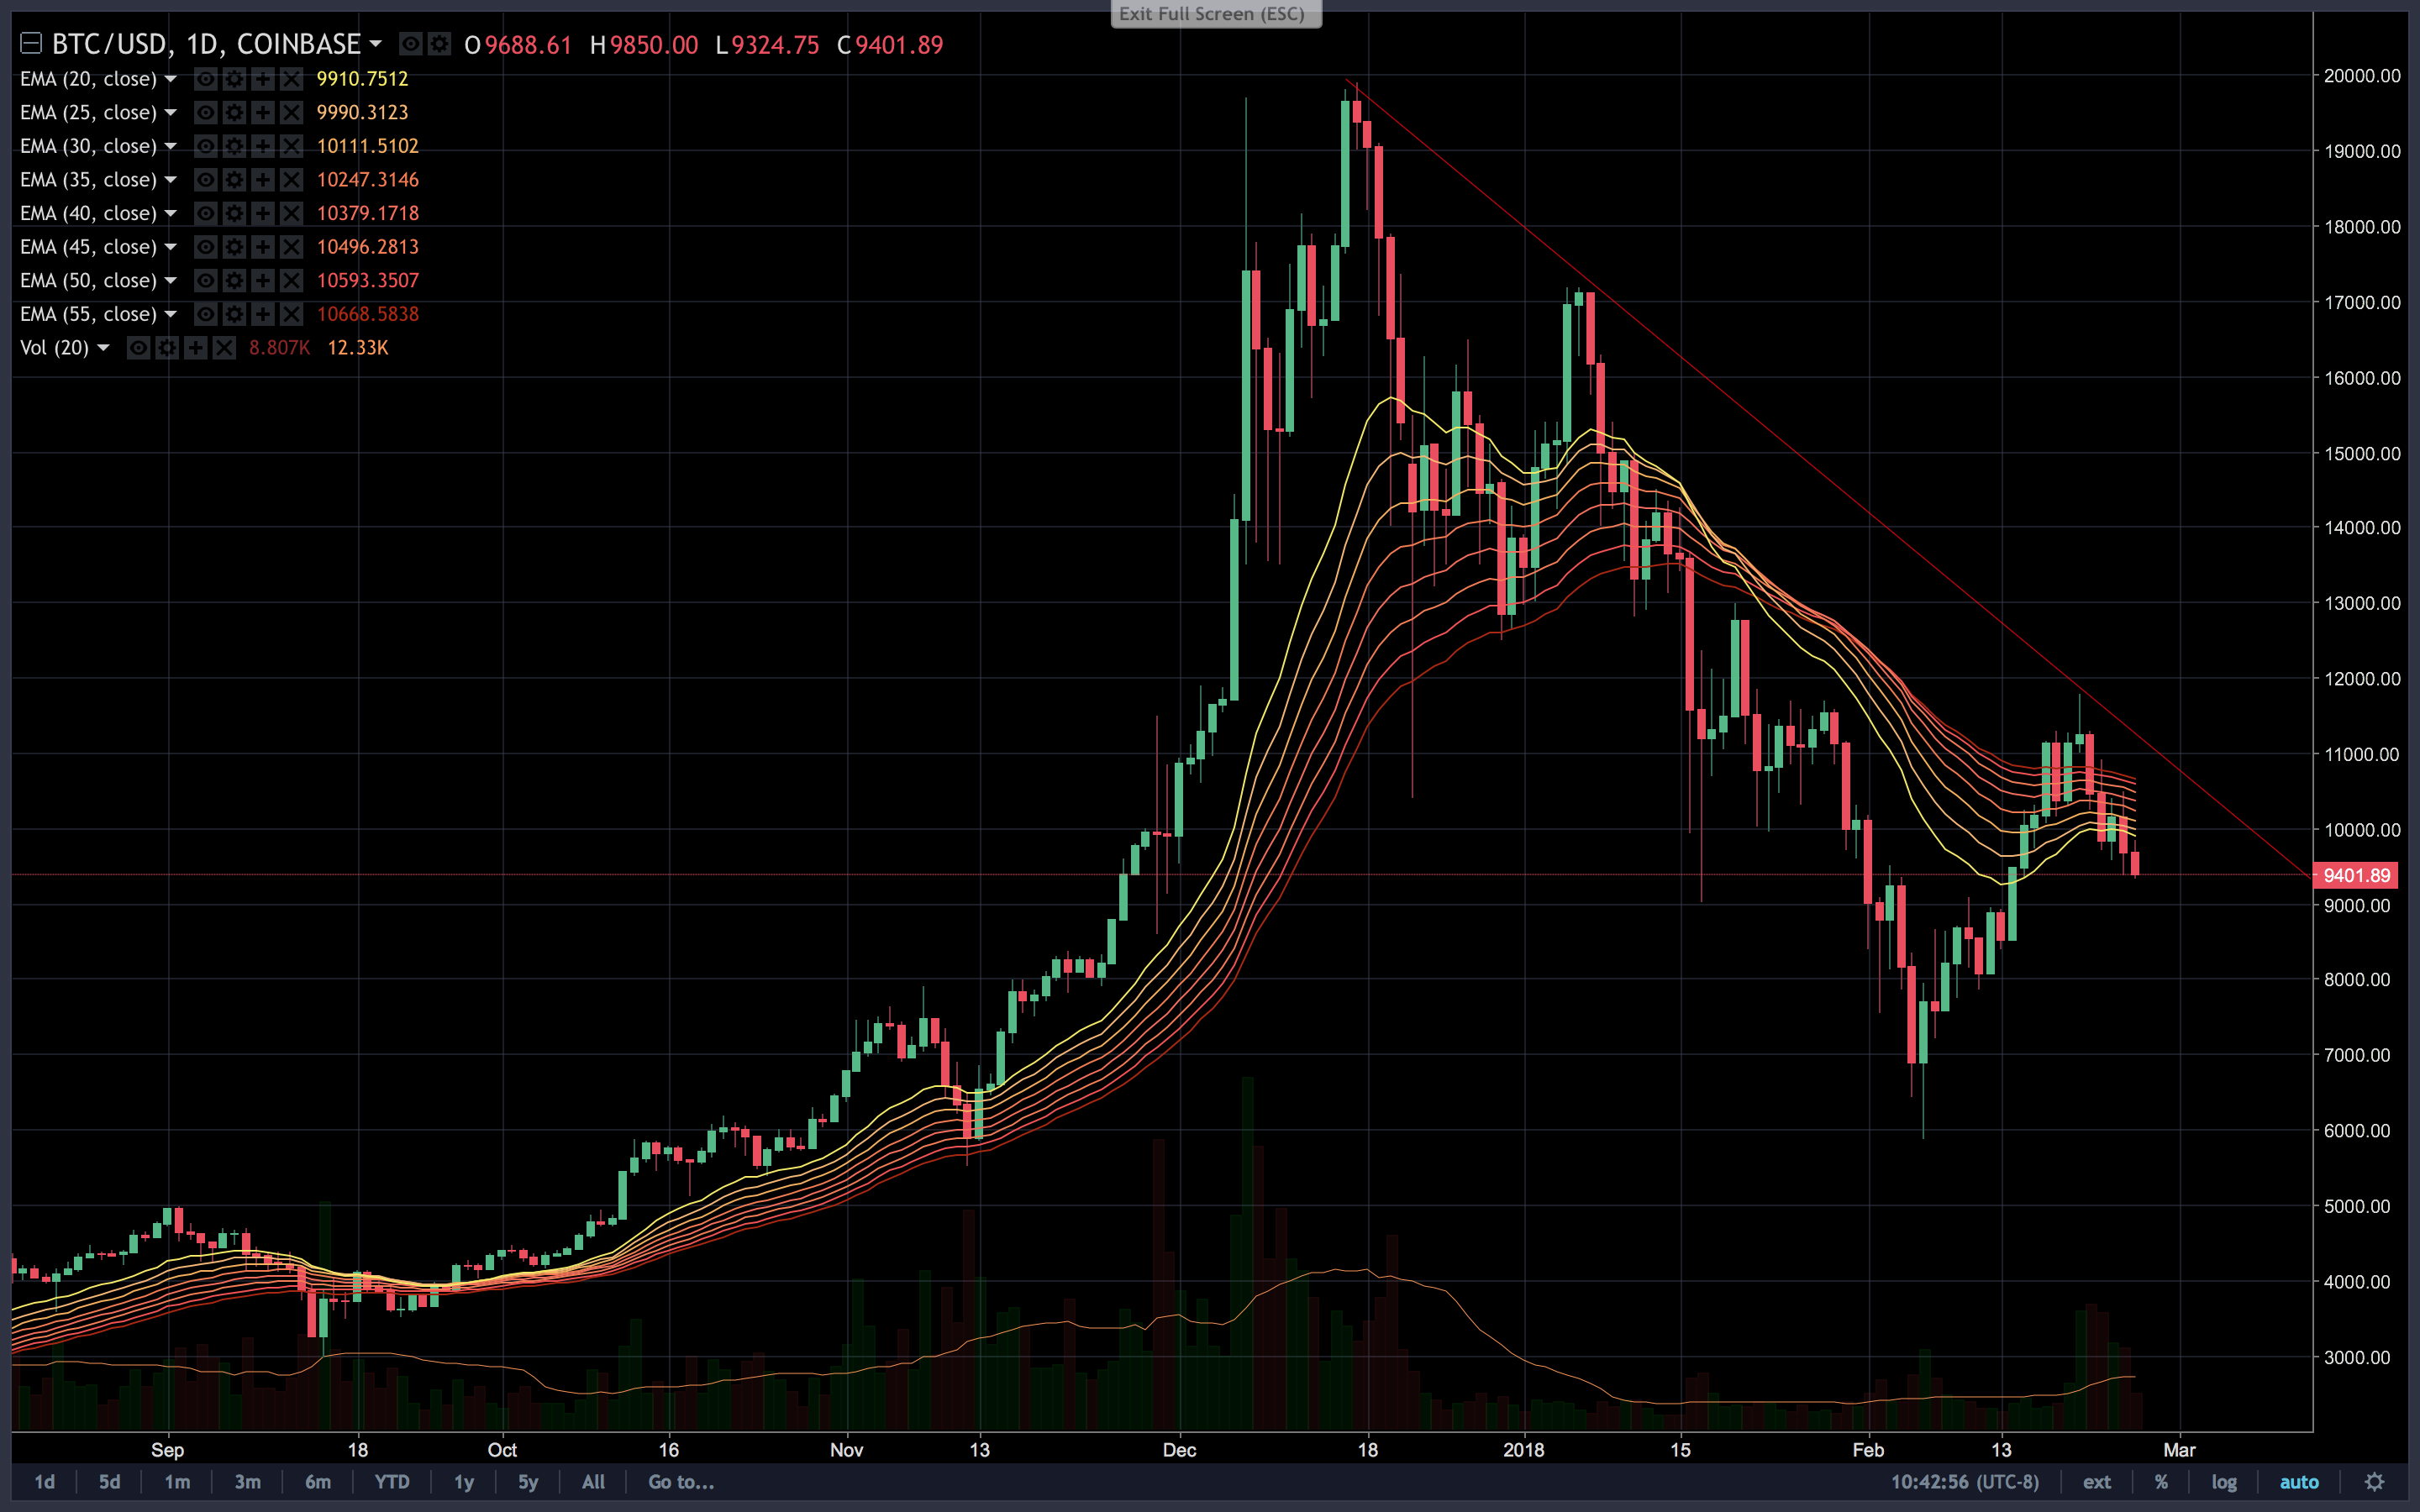
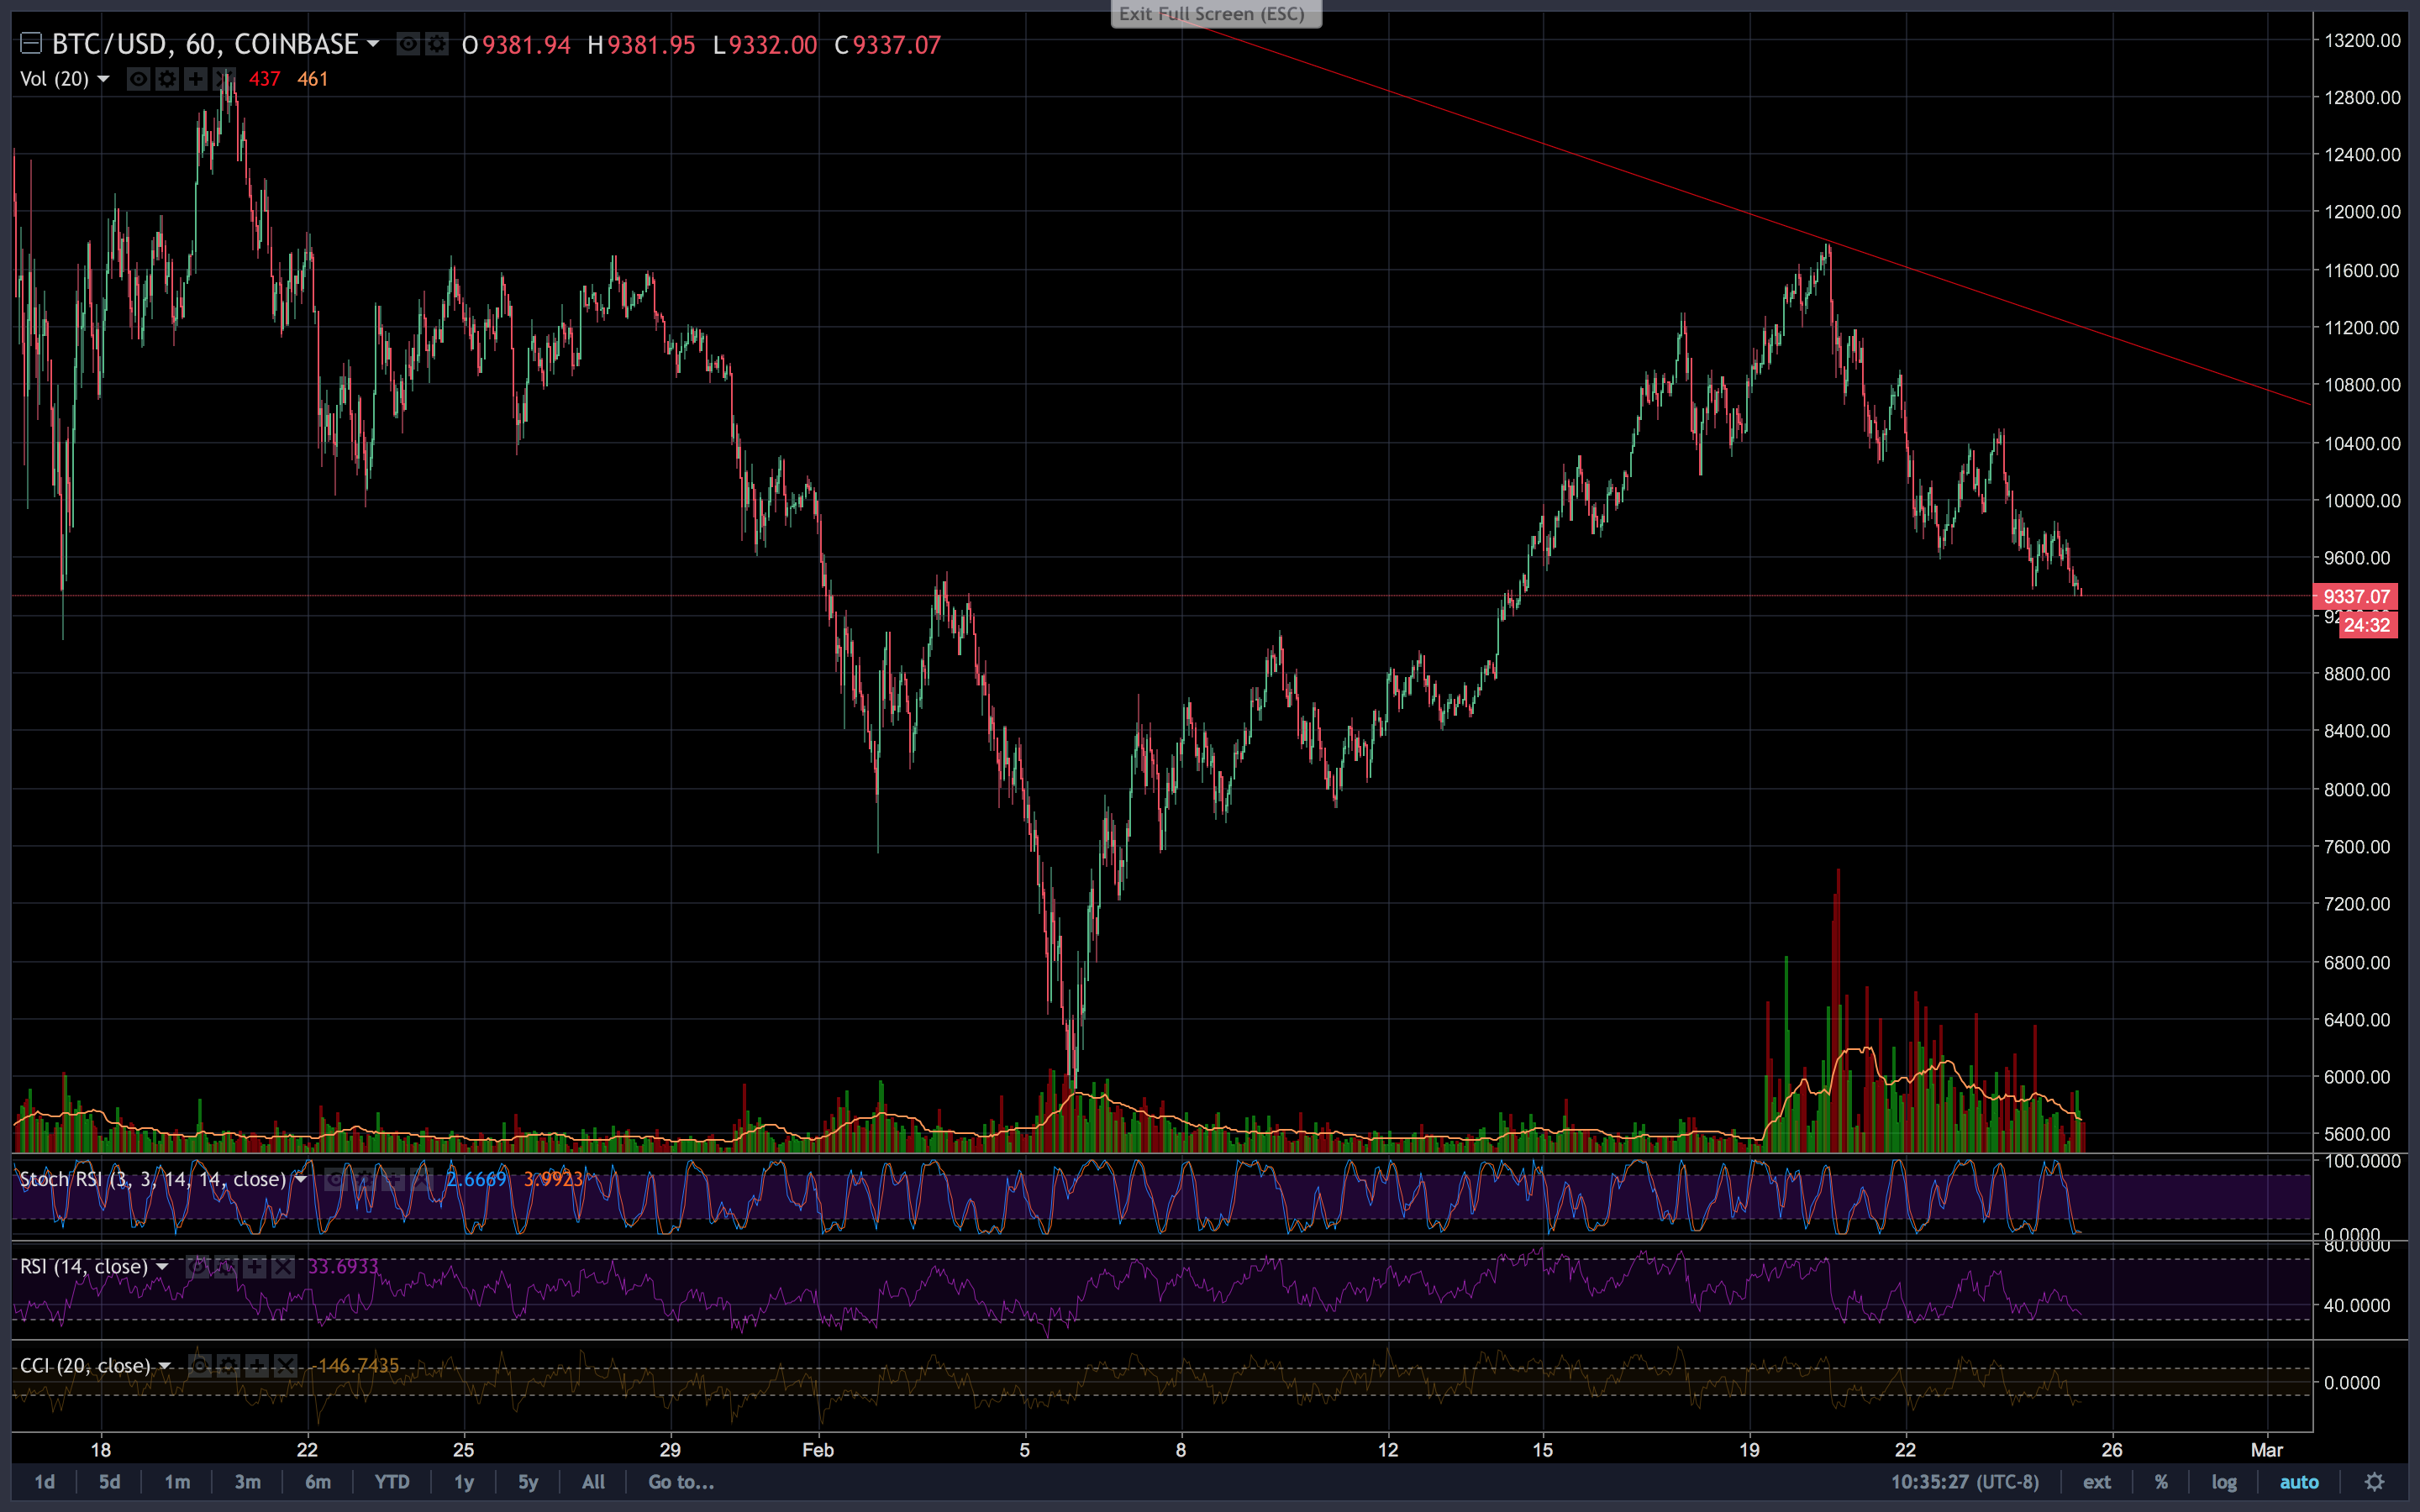
 So many signs that Bitcoin has hit the top. Let's take a look...starting with the daily chart above. <b>1) Volumes at the peak</b> I talk about volumes a lot. Thankfully, we don't see too many dark pools screwing with the volume counts so what we see is pretty accurate. One of the things that stands out is that the huge bull volume candle resulted in a bearish looking reversal candle at the top of the daily with the upper wick about 3x the size of the body showing weakness. In addition, we saw bear volume show up and outperform the bull volume. This huge amount of BTC's being sold shows that prices are rejecting at this level which didn't meet up with the next high above $12,000. <b>2) Trend Line</b> Bitcoin rallied and rejected from the trend line set by the last two peaks; downward trend line is still in effect...nuff said. <b>3) Daily Technicals</b> Daily technicals have all rolled over and are showing bearish pressure. MACD finally caught up to the rest and had a bearish crossover.  <b>4) Moving Averages</b> Bitcoin saw a break above EMA resistance, but failed to hold. BTC then was unable to establish EMA levels as support and now we are back to bearish with no signs of trend reversal since there was no crossover.  <b>5) Hourly Volumes</b> Again, let's look at volumes. The biggest bull volume bar was nowhere near the peak. In addition, the bear volume bar was larger than the biggest bull bar and was at the peak signaling a rise in selling pressure at this level. <h1>Happy trading!</h1>