Bitcoin May See a Rally to $15,000 If this Happens!
cryptocurrency·@gentlemansjack·
0.000 HBDBitcoin May See a Rally to $15,000 If this Happens!
<h2>Key Points</h2> Major Support Level – $7,020 Major Resistance Level – $7,400 Bitcoin price is struggling to hold the $7,250-7,300 support area at the moment. However, the chart is showing me that a bounce could be due here soon. The volume on the buy side at $7000 compared to volume of the bears outweighs it by a mile. Price should be able to hold above $7000 near term to regain traction and head back toward the upside. The selling pressure from the bears looks like it is weakening here. <h2>Analysis of Bitcoin Price</h2> There were a couple of rejections noted around $7,500 level in bitcoin price against the US Dollar. The BTC/USD pair started a downside move and declined below the $7,400 and $7,300 support levels. It even settled below the $7,400 pivot and the 76.4% Fib retracement level of the last wave from the $7,260 low to $7,648 high. The current price action suggests that a downside break will only happen if we see massive sell pressure taking us below $7150 which seems unlikely. At the moment, the price is testing the 1.236 Fib extension level of the last wave from the $7,260 low to $7,648 high. The 1.618 Fib extension level of the last wave from the $7,260 low to $7,648 high is at $7,020 to act as a support. 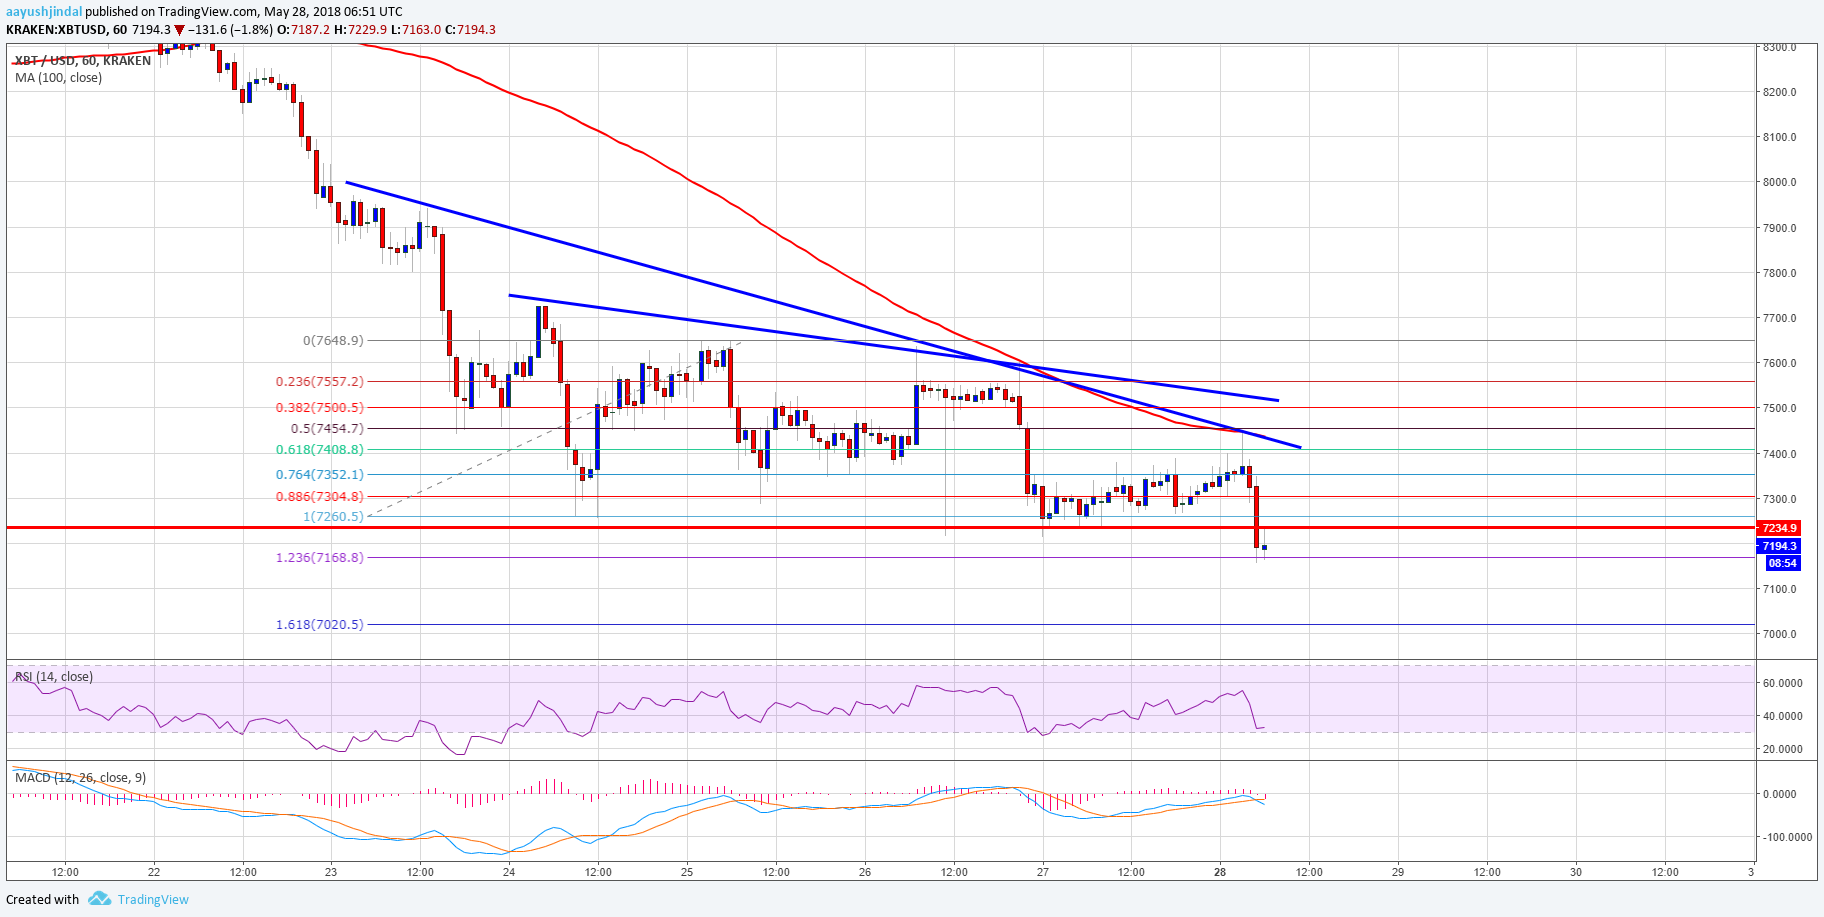 The chart above is showing that the price may struggle to break the $7,300 and $7,400 resistance levels. The bulls need to close price above 7500 to move price in a positive direction. What the Technical Indicators are Showing: Hourly MACD – The MACD on the hourly looks bearish still but the daily indicator looks ready for an upside move. Hourly RSI (Relative Strength Index) – The RSI is now well below the 40 level. <a href="http://steemit.com/@gentlemansjack"><img src="https://steemitimages.com/DQmXNeEvEqmZsAYpK6S2Qr5s1mukwaXjCMyVjgCu3PV9VWy/image.png"/></a>