HOW TO SOLVE THE BIGGEST PROBLEM WITH TREND LINES - Live Workshop 'FOLLOW ALONG' Guide
trading·@herronryan·
0.000 HBDHOW TO SOLVE THE BIGGEST PROBLEM WITH TREND LINES - Live Workshop 'FOLLOW ALONG' Guide
 This is a guide for the workshop, ## "HOW TO SOLVE THE BIGGEST PROBLEM WITH TREND LINES". <iframe width="560" height="315" src="https://www.youtube.com/embed/Wp4a-PiFA4s" frameborder="0" allow="autoplay; encrypted-media" allowfullscreen></iframe> # Workshop OUTLINE: * ### Basic Overview of Trend Lines 1. Standard Horizontal Support & Resistance 2. Standard Diagonal Trend Line 3. Channels, Triangles, Flags * ### 'Secrets' most traders don't know 1. Trend Lines are Relative to the chart you are looking at. 2. How to Tell When a Trend Line will get Weaker ( The 'Debunk') 3. The 'Triple T' Strategy (Multiple Time Frame Analysis * ### Inverted Trend Lines 1. Standard Inverted Trend Line 2. One Two Punch!  # Workshop Guide: ### Basic Overview of Trend Lines <blockquote> <h3>✅ Pay Attention ✅</span></h3> <h3>A trend line is a line drawn atop highs or under lows. This shows the overall direction of price. Trend lines are a visual representation of support and resistance. You can use it on any time frame. The purpose of a trend line is to see the 'Line of a Trend'</h3> <p> </p> </blockquote> ### Standard Horizontal Support & Resistance Horizontal Support & Resistance requires only 1 point of reference. 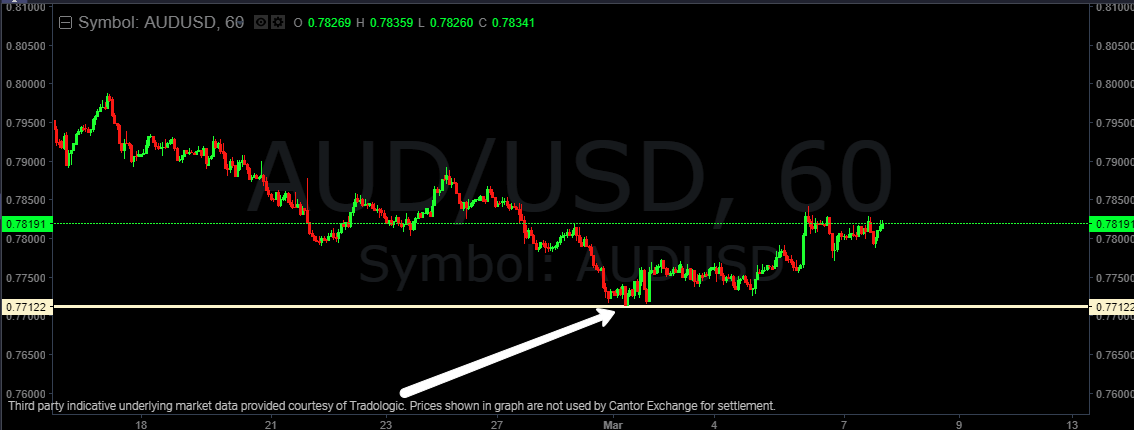 ### Standard Diagonal Trend Line Diagonal Support & Resistance requires 2 or more points of reference. 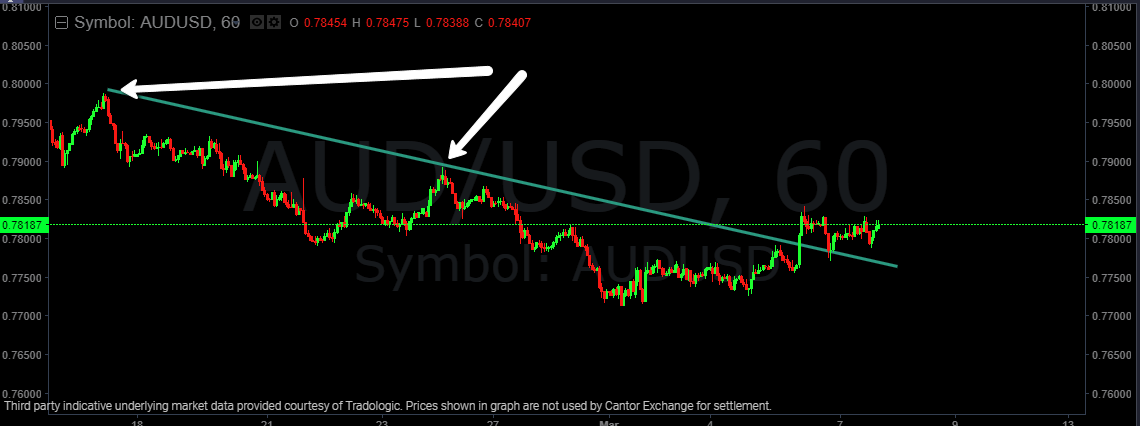 *NOTE: Buying or Selling on the 3rd touch of a 'well spaced' trend line is a good idea.* ### Standard Trend Line Break 1. Price breaks through a trend line. 2. On most occasions, price falls back to the trend line before continuing in the direction of the broken trend line.  # Channels, Triangles, Flags ### Channel 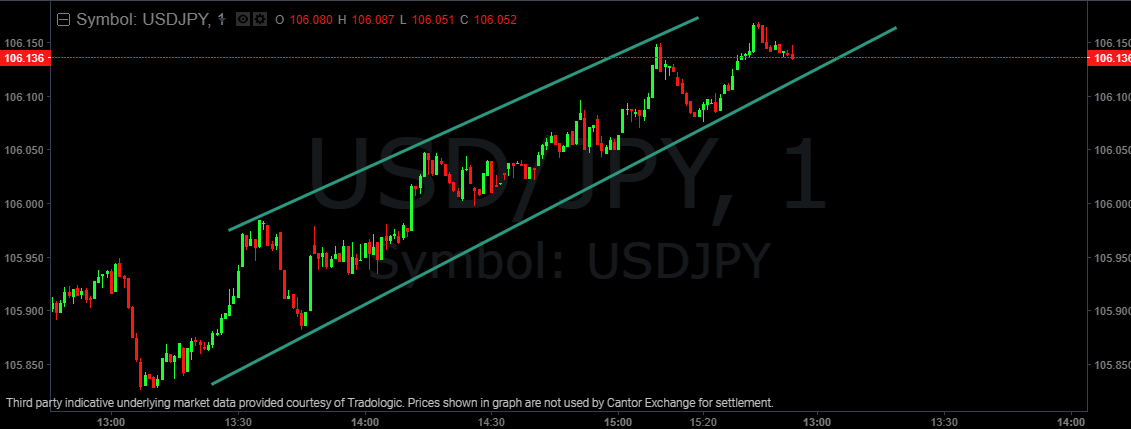 ### Triangle 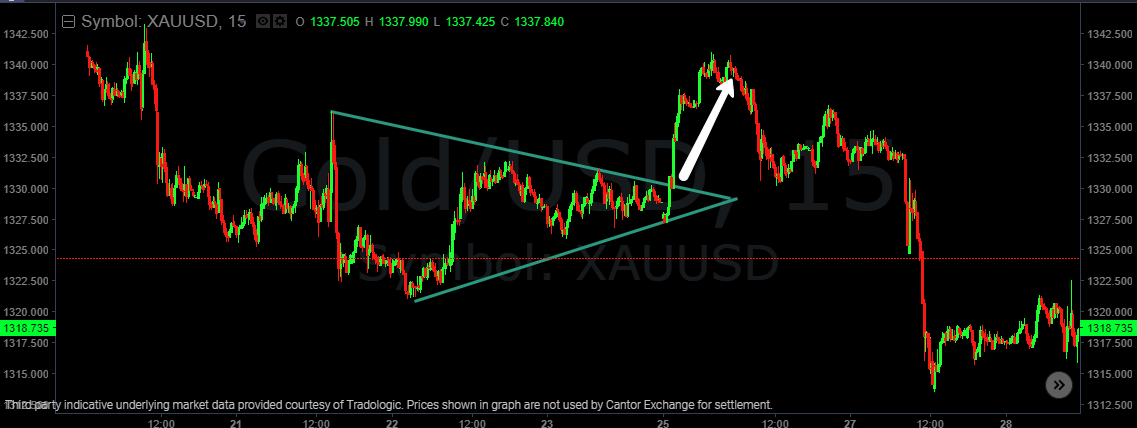 Trend Lines are magical. Look what happens when i simply extnd this triangle into the future to form an X. Price touches the *NEW* trend lines almost to the pip! 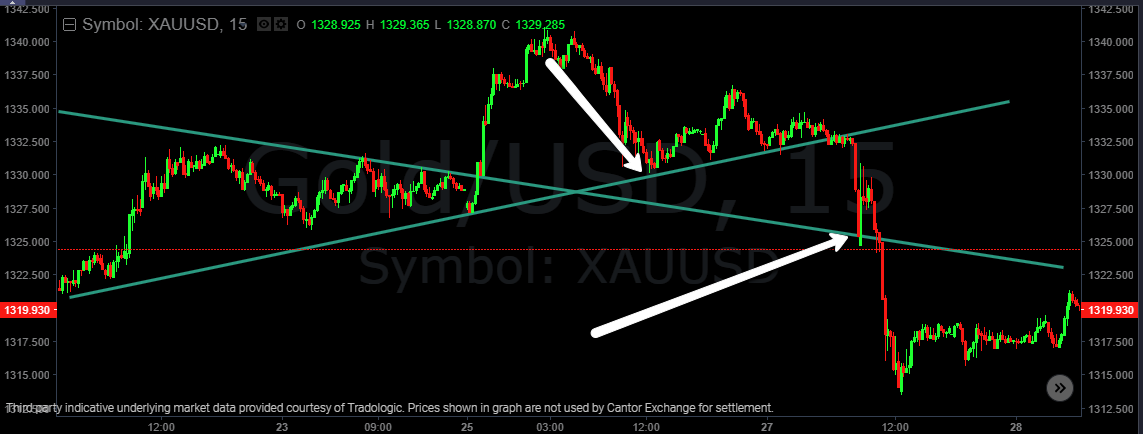 ### Flag 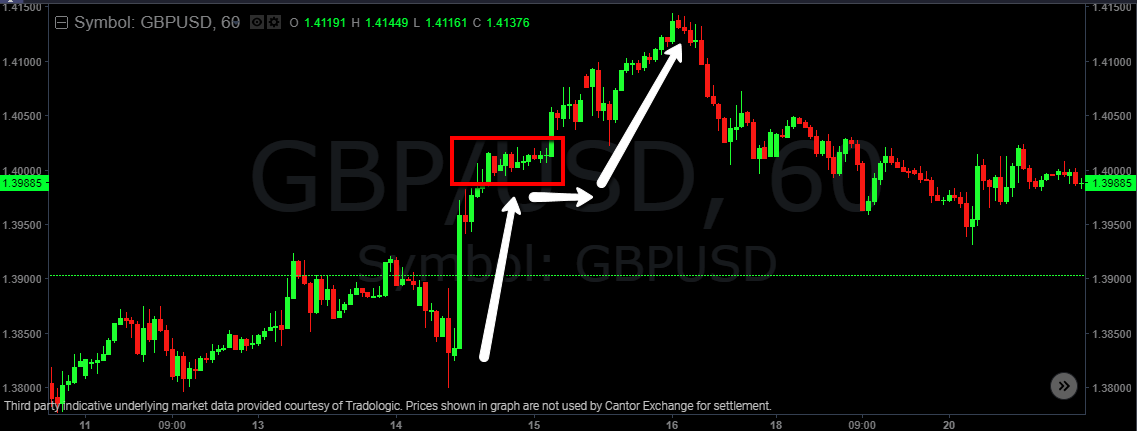 # 'Secrets' most traders don't know ### Trend Lines are Relative to the chart you are looking at. Always look at a daily chart to find the direction of the overall trend. Never ever base a trend on a 5 minute chart. ### Here is a daily chart of EURUSD 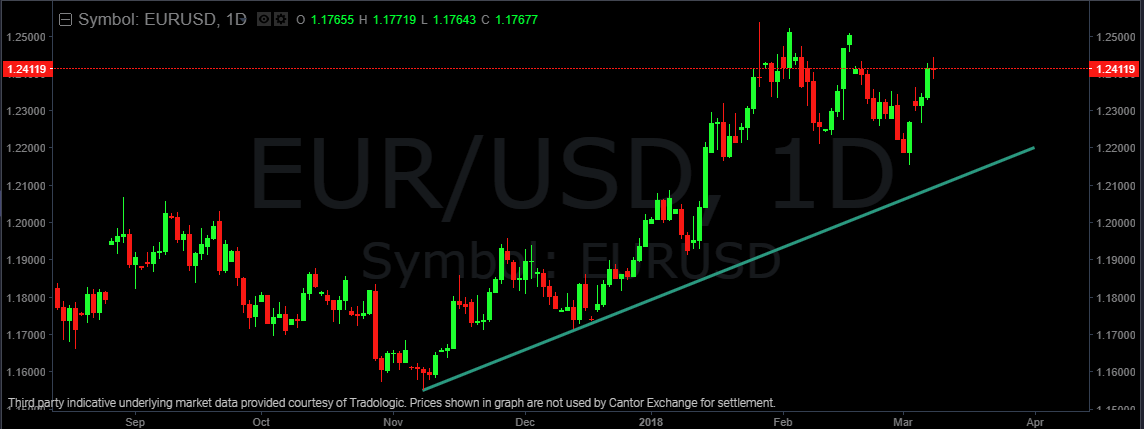 ### We can see that the uptrend is a bit wobbly. Ask yourself: ##### Where would be a good buying area? (since it is still in an uptrend) Below, you can see an HOURLY chart of the EURUSD 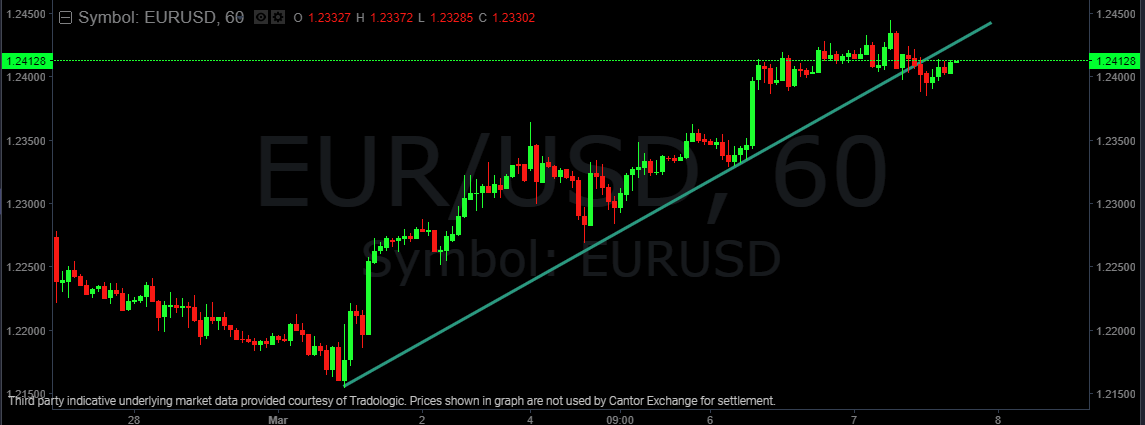 Price broke down below an hourly trend line so I will want to stay out or put my stop really close under the nearest low. Even though I don't want to trade here (YET), knew by looking at a higher time frame chart that price was in an uptrend. Trend Lines can help confirm bad trades before we risk any money. # How to Tell When a Trend Line will get Weaker ( The 'Debunk') #### Trend Lines do not get stronger the more times they are touched. They get weaker! 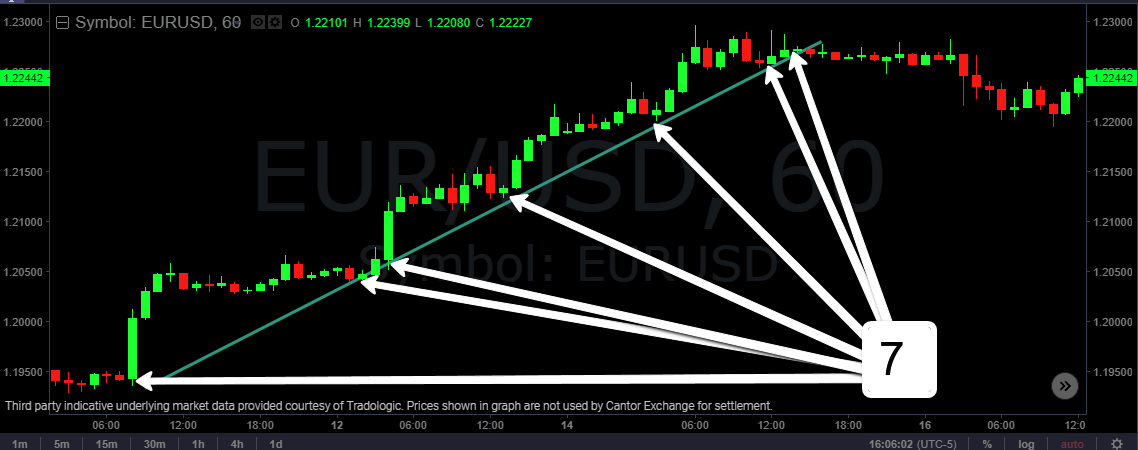 ### The 'Triple T' Strategy (Multiple Time Frame Analysis This strategy simply involves getting 3 charts to 'ADD UP' before placing a trade. For instance, if you are going to place a buy order, make sure the daily, hourly, and 5 minute charts are all pointing to buy opportunities. Don't just look at one chart. # Cantor Exchange Strategy Perfect for Binary or Digital Options! One thing that Inverted Trend Lines can be used for is placing a binary option that ends at the end of the bar that touches the inverted trend line on the 3rd touch. ## Inverted Trend Lines ### Standard Inverted Trend Line  ### One Two Punch! 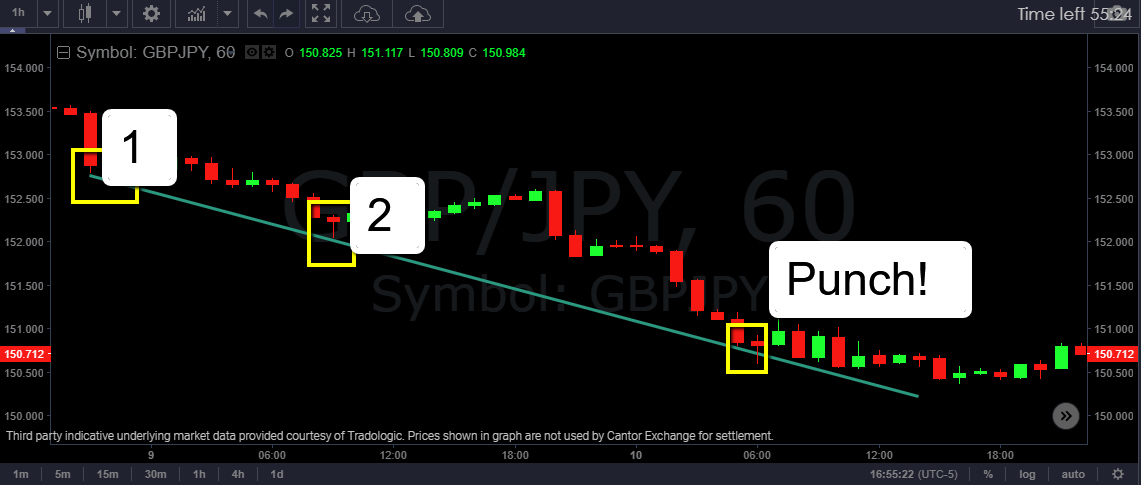 This 'Follow ALong' Guide will help you stay on target during the workshop. See you then! # Happy Trading! 
👍 hatu,