Tesla Stock Statistics Inside
tesla·@herronryan·
0.000 HBDTesla Stock Statistics Inside
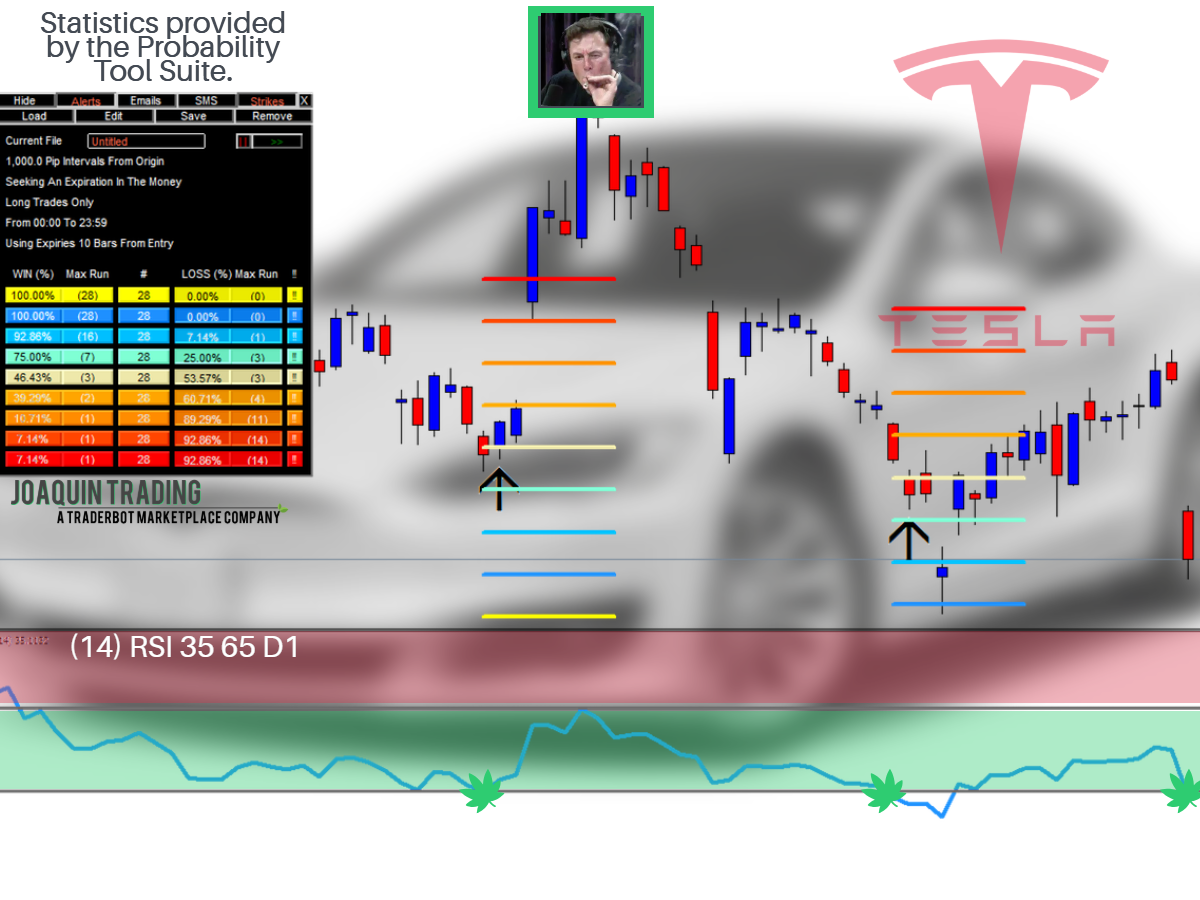.png) <h1><strong>Elon, The Joint & The Suits</strong></h1> <p>We all know Elon took a puff from a joint and tweeted some stuff about how the stock was going to $420 and the SEC fined him yad yada. This isn't another story about it. This article will give statistics about the direction of the stock based on historical outcomes.</p> <p>All Statistics provided were supplied by the Probability Tool Suite from Joaquin Trading at <a title="Joaquin Trading - Home of the Probability Tool Suite" href="https://joaquintrading.com" target="_blank" rel="noopener">https://joaquintrading.com</a></p> <p>My only comment about this, other than what I can gather statistically is this: I commend the man and think he is a visionary. I'm glad he smoked a little weed for all to see. (He didn't really. What he did wasn't really toking a joint.) The reason I am glad is that cannabis has never killed anyone in history, unlike all these pharmaceuticals.</p> <p>Before we get into the probabilities, allow me to protect my own rear...</p>  <h2>Probabilities on Daily data gathered since 2013.</h2> <p>Price, as of right now on Saturday, September 29, 2018, has a 46.43% probability of being higher than $264.72 10 trading days from now. This means that it also has a 53.57% probability of being lower than where it is right now, 10 trading days from now.</p> <p>This particular signal is based upon the RSI indicator, on the daily chart. The oversold area is 37. We are looking at long trades only. Why did I choose 37, instead of the normal 30 are? This was done to see where price may be from the price point of TODAY. I wanted to know if the price had a good chance of recovering, based upon the historical data that we have already seen from this security.</p> <p>We need to factor in the fact that Elon never smoked weed or promised all these things before. This may totally negate everything that I am speaking about today. I am basing my findings on historical probabilities only.</p> <p>What else do we know:</p> <p>According to 28 historical outcomes, in 10 trading days from today, price has a probability of <strong>closing</strong> above:</p> <ul> <li>$304 7% of the time</li> <li>$294 7% of the time</li> <li>$284 10% of the time</li> <li>$274 39% of the time</li> <li>$264 46% of the time</li> <li>$254 75% of the time</li> <li>$244 92% of the time</li> <li>$234 100% of the time</li> <li>$224 100% of the time</li> </ul> <p>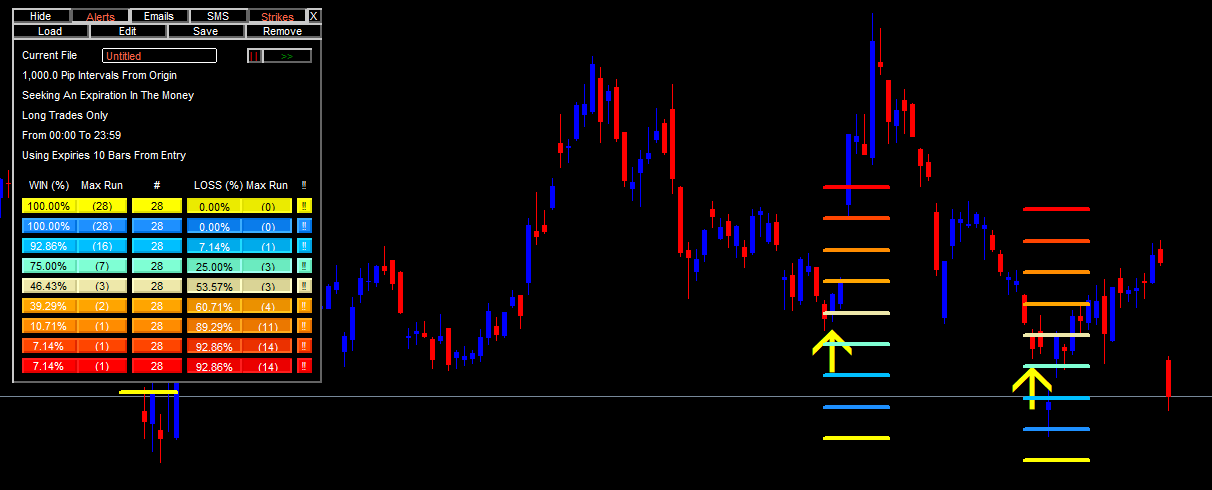</p> <p>By looking at the data, we can see that every single time this particular scenario happened, price closed within a $20 drop a whopping 92% of the time. It closed above a $30 drop every single time. How much of this new cannabis & $20 & SEC news would cause these probabilities to break down?</p> <p>Who knows? Only time will tell.</p> <h2>Price Touches</h2> <p>We also analyzed data to see how often price <strong>touched</strong> certain areas, based upon the parameters given. A touch means price doesn't necessarily have to close above a certain area; it merely needs to touch.</p> <p>According to 49 historical outcomes, in 10 trading days from today, price has a probability of touching these price areas:</p> <ul> <li>$304 6% of the time</li> <li>$294 8% of the time</li> <li>$284 24% of the time</li> <li>$274 46% of the time</li> <li>$264 NA Price is already there.</li> <li>$254 51% of the time</li> <li>$244 24% of the time</li> <li>$234 10% of the time</li> <li>$224 2% of the time</li> </ul> <p>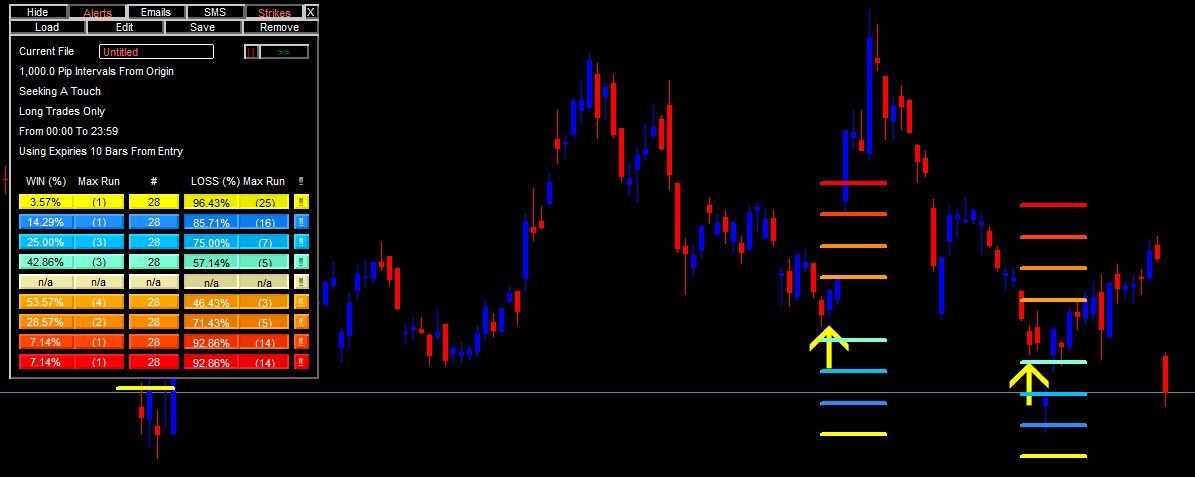</p> <p>We had 49 historical outcomes to look at because instead of looking at long-only signals, we are also looking at shorting opportunities.</p> <h2>How about Trading the actual stock?</h2> <p>Based upon 55 historical outcomes, If you are trading both long and short &set your take profit at $10 and your stop loss at $10, you would win the trade only 38.18% of the time.</p> <p>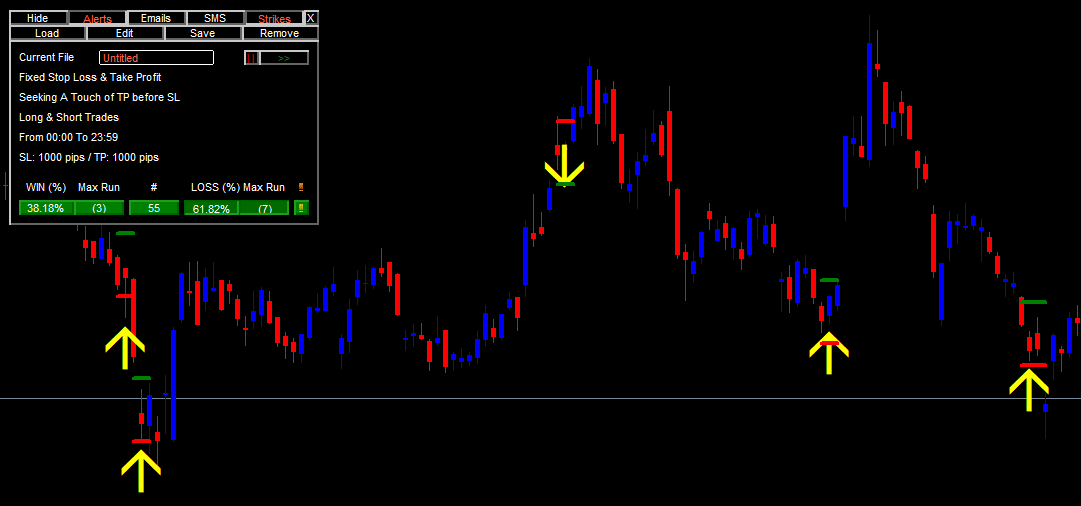</p> <p>However, if you are trading long only, your win percentage jumps to 45% but it's still no good.</p> <p>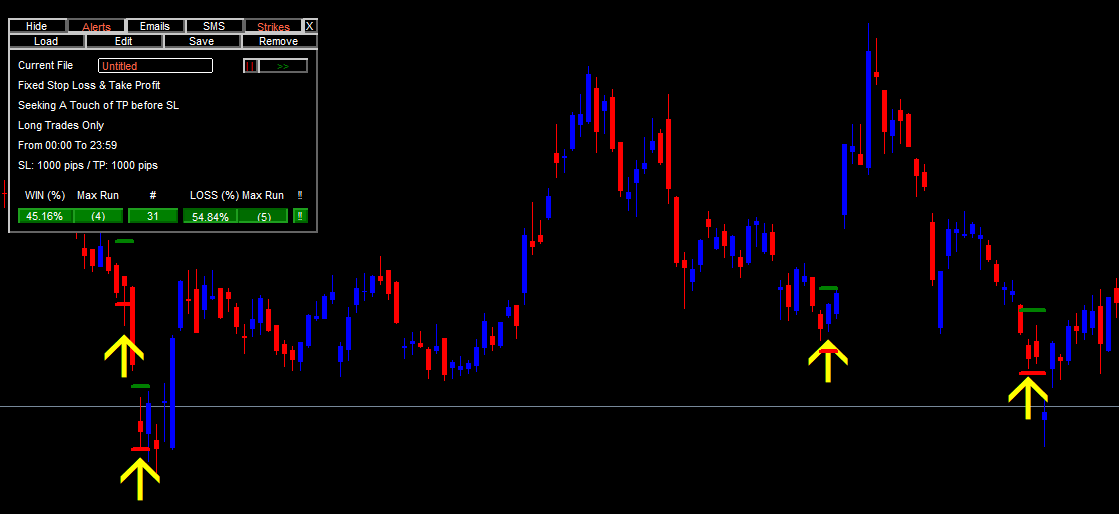</p> <p>If you were to move that stop-loss to $25 and your take profit to $25, you would have won this trade 56% of the time.</p> <p>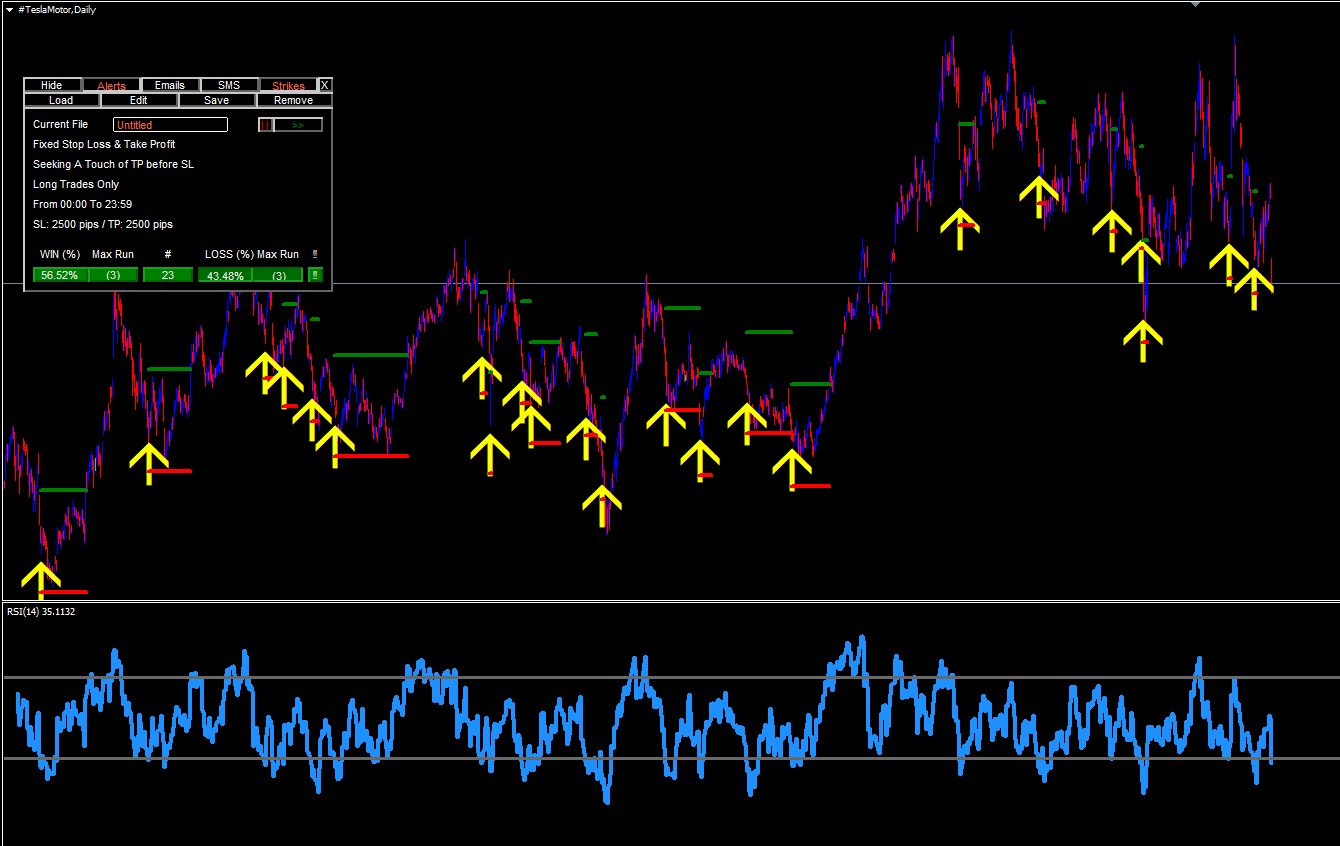</p> <p>If you enjoyed this data and learned something, let me know what YOU would like analyzed in the future.</p> <p>If you would like to see more of the Probability Tool Suite in action, sign up for our free Weekly Signals at <a title="Joaquin Trading - Home of the Probability Tool Suite." href="https://joaquintrading.com" target="_blank" rel="noopener">https://joaquintrading.com</a></p> <p> </p>
👍 fastresteem,