Technical analysis on bitcoin after hitting $100,000
teammalaysia·@hooiyewlim·
0.000 HBDTechnical analysis on bitcoin after hitting $100,000
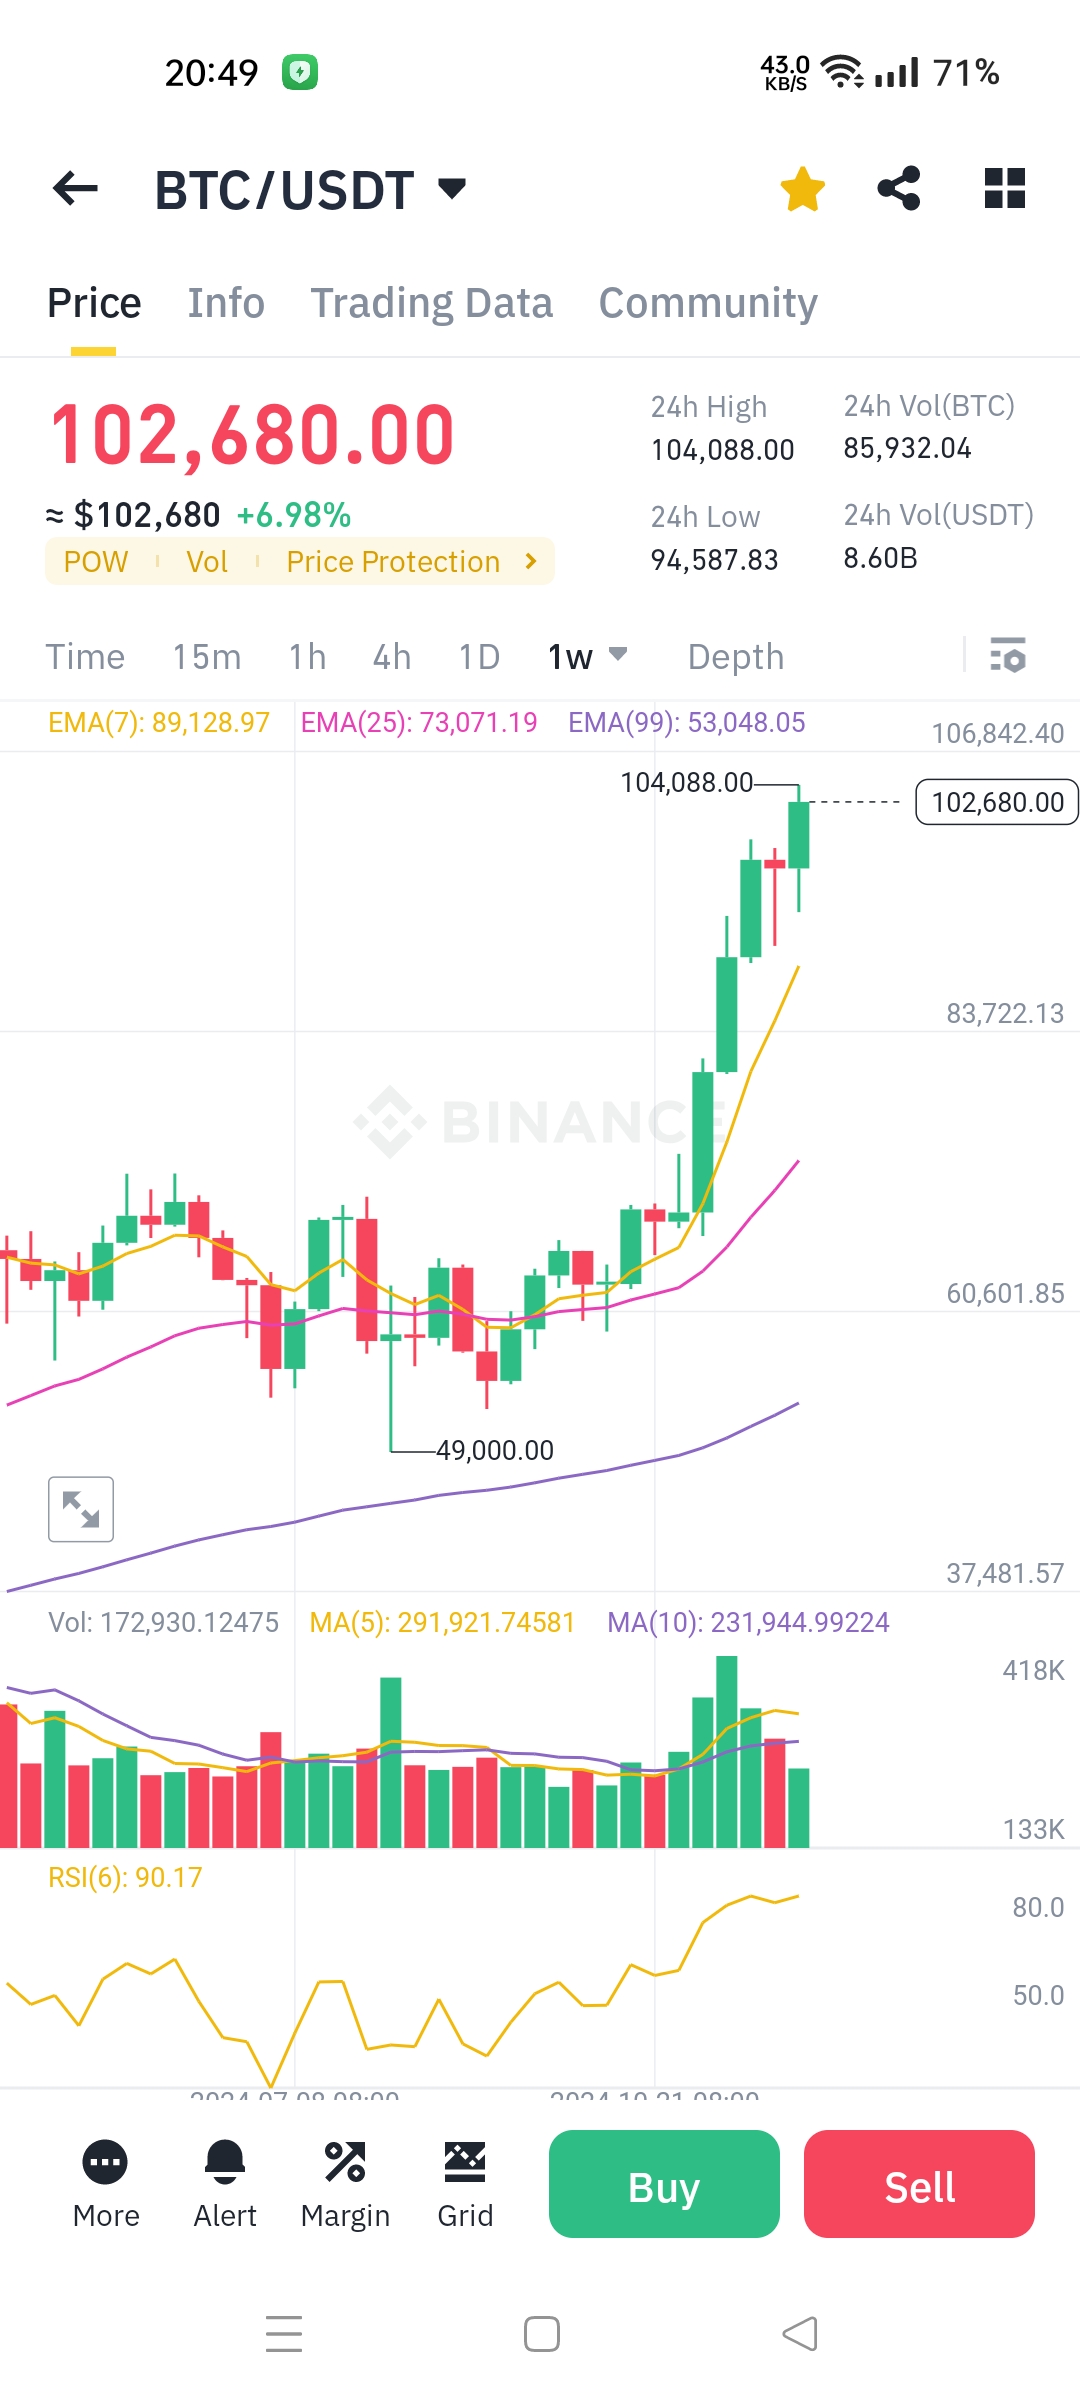 Based on the technical analysis, the situation suggests **mixed signals**: --- ### **Signs of a Potential Top:** 1. **Overbought RSI (90.17):** - An RSI above 70 typically signals overbought conditions, and at 90+, the market is extremely stretched. - Historically, such high RSI levels often precede **corrections** or at least **consolidation**. 2. **Parabolic Price Action:** - The rapid and steep rise indicates the price is moving in a **parabolic trajectory**, which is unsustainable in the long term. - Parabolic moves often result in sharp corrections when momentum fades. 3. **Resistance Levels Approaching:** - The immediate resistance at **104,088 USDT** (recent high) and **106,000 USDT** (psychological level) could act as barriers, leading to selling pressure. --- ### **Signs of Continued Pump:** 1. **Strong Volume:** - The price rally is backed by **significant trading volume**, suggesting **genuine buying interest** rather than weak or speculative moves. 2. **Momentum Above EMAs:** - BTC is comfortably above its **EMA(7), EMA(25), and EMA(99)**, indicating **strong bullish momentum** across short, medium, and long-term trends. 3. **No Clear Reversal Patterns Yet:** - There are no visible signs of bearish reversal patterns like a **double top** or **bearish divergence** on the RSI or price. 4. **Market Sentiment:** - A euphoric phase (FOMO - Fear of Missing Out) in a bull run can push prices higher, even in overbought conditions. --- ### **Conclusion:** - **Short-Term Top Likely Near:** The extreme RSI and parabolic nature of the move suggest BTC is **approaching a local top**, and a **pullback** or **sideways consolidation** is likely in the short term. - **Further Upside Possible with Caution:** If BTC breaks above **104,000-106,000 USDT** with strong volume, it could push toward **110,000 USDT or higher**. However, the risk of a sudden correction increases at these levels. --- ### **Key Levels to Watch:** 1. **Upside:** - Break above **104,088 USDT** → Target **106,000 USDT**, then **110,000 USDT**. 2. **Downside:** - If BTC loses **94,500 USDT**, it could drop to **83,700 USDT** (major support).
👍 spaminator, chadmichaellibby, trautenberk, sahil07, isaaclim, ssg-community, psychkrhoz, bdmillergallery, thejollyroger, senstless, thisismylife, cornerstone, scooter77, bulliontools, portugalcoin, hooiyewlim, dylanhobalart, fat-elvis, willielow, daveks, artonmysleeve, danielwong, littledrummerboy,