Analysis of Bitcoin prices[↻50%]
sbdgiveaway·@ivan2018·
0.000 HBDAnalysis of Bitcoin prices[↻50%]
 The bitcoin rate is below the support line of $9400. On 4-hour chart of the pair BTC/USD can be observed breakthrough two ascending trend lines in the region of $10 000. In the short term, possible breakout of the support $8410, and then may be followed by a series of new drops. During this week, the bitcoin rate fell by 25%. Important support lines such as $10,000 and $9400 have been broken through. Further descent is very likely, up to $ 8000. More importantly, it was also impossible to keep two uptrend lines at around $10,000. Now trading is below the support line of $9400 and a simple moving average of 100 days. Short-term low has formed in the neighborhood of $8413. The road for further growth is blocked by resistance at $ 9400-9500 (earlier support was located at $9400). The decline may continue in the near future, and under threat will already mark $8400. 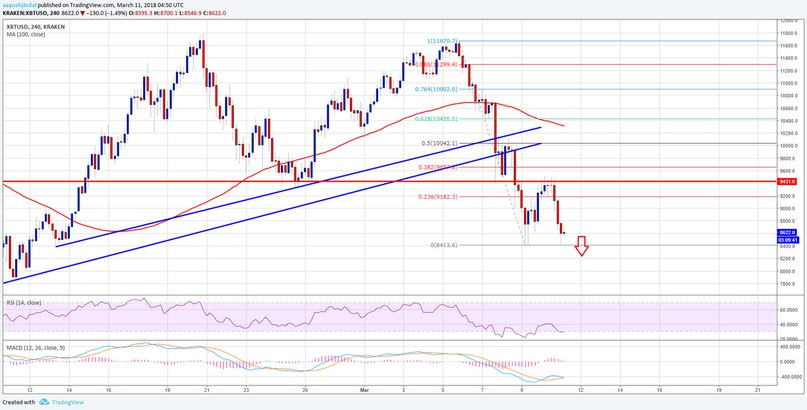 If the current trend continues, the decline could continue below $8000, down to $7,600. The convergence/divergence of moving averages (MACD) for BTC / USD pair, however, remains in the bullish zone, however, the relative strength index (RSI) is below 40. The main support level is $8000, the resistance level is $9400.