STEEM - Has its price bottomed ?
vincentb·@jmsm2·
0.000 HBDSTEEM - Has its price bottomed ?
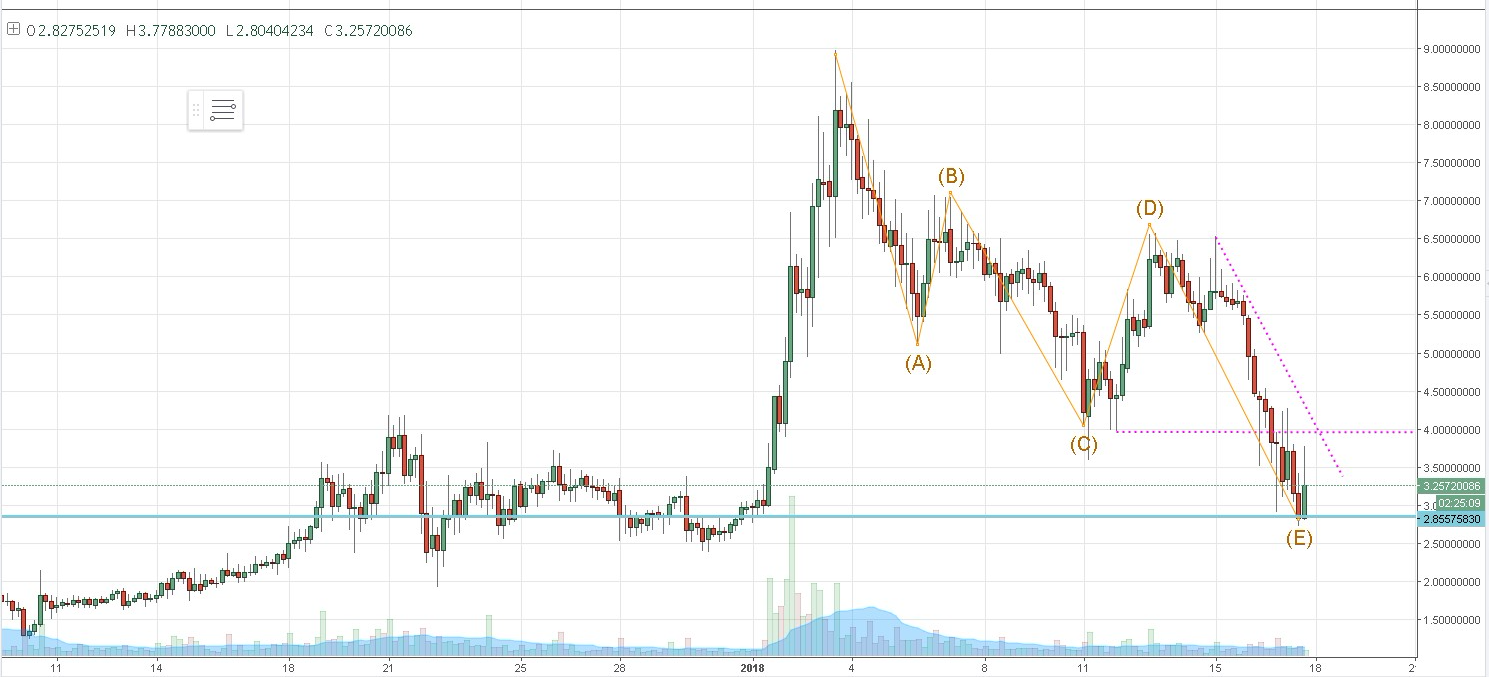 Based on my chart reading, I believe it has probably bottomed out at around $2.80 (which is the end of Wave E on the 4-hourly chart above). This is also the key support level going back to June last year (shown by the solid horizontal blue line) before it broke out to the upside on the 1-Jan-18. A confirmation of this bottoming out process would be if and when the price moves up above $4.2 (i.e. above the down-trendline shown in pink dotted line on this chart). So, it's important to watch the price action around the down-trendline to have more confidence in whether it has bottomed out. Update on 18-Jan-18: So far, it's mapping out as expected. The next key resistance level is top of the shaded channel at around $5.6 (see updated chart below). If it can go above that, then the price is likely to continue rising, probably quite sharply. 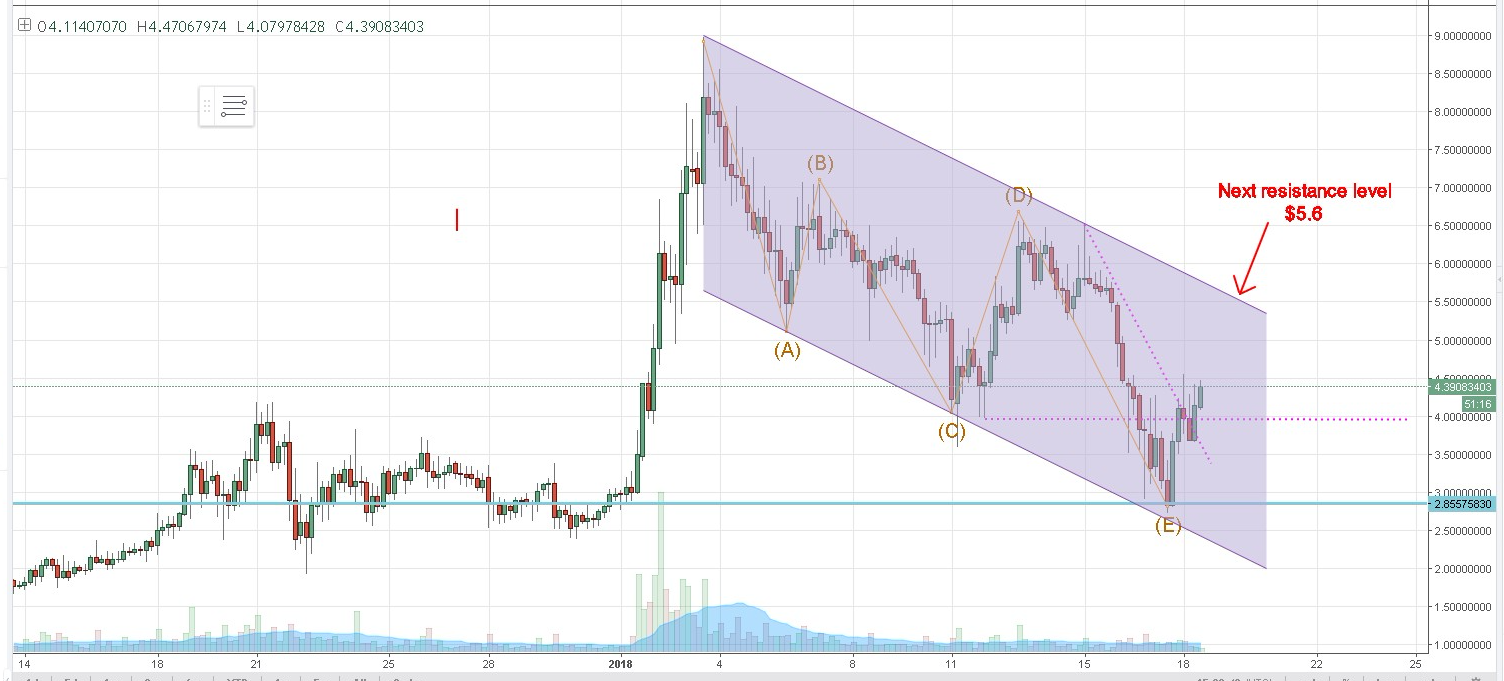 Update on 19-Jan-18@11.00UTC: On the hourly chart, the price seems to be forming an ascending triangle after the recent rise. If it can go above and stay above $4.7, then my next target would be $5.4 which is near the top of the shaded channel (see chart below). 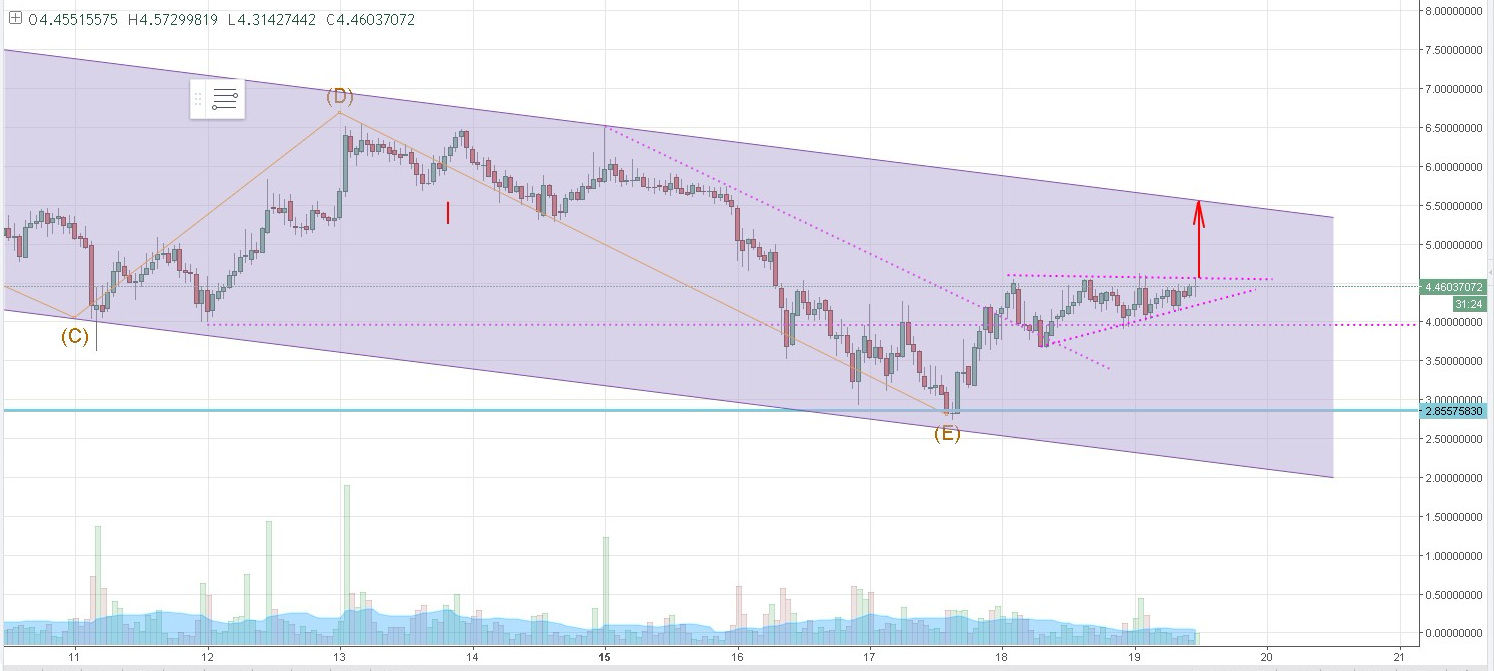 Update on 24-Jan-18: As expected, the price did go up to the top of the channel (i.e. around $5.7 shown as Point 1 on the updated chart below) and then after a brief correction down to $3.8 (point 2), it is now heading up to complete wave 3 (probably around $7.1). The rough path for waves 4 and 5 is also shown on this chart but this is better assessed after we complete wave 3. 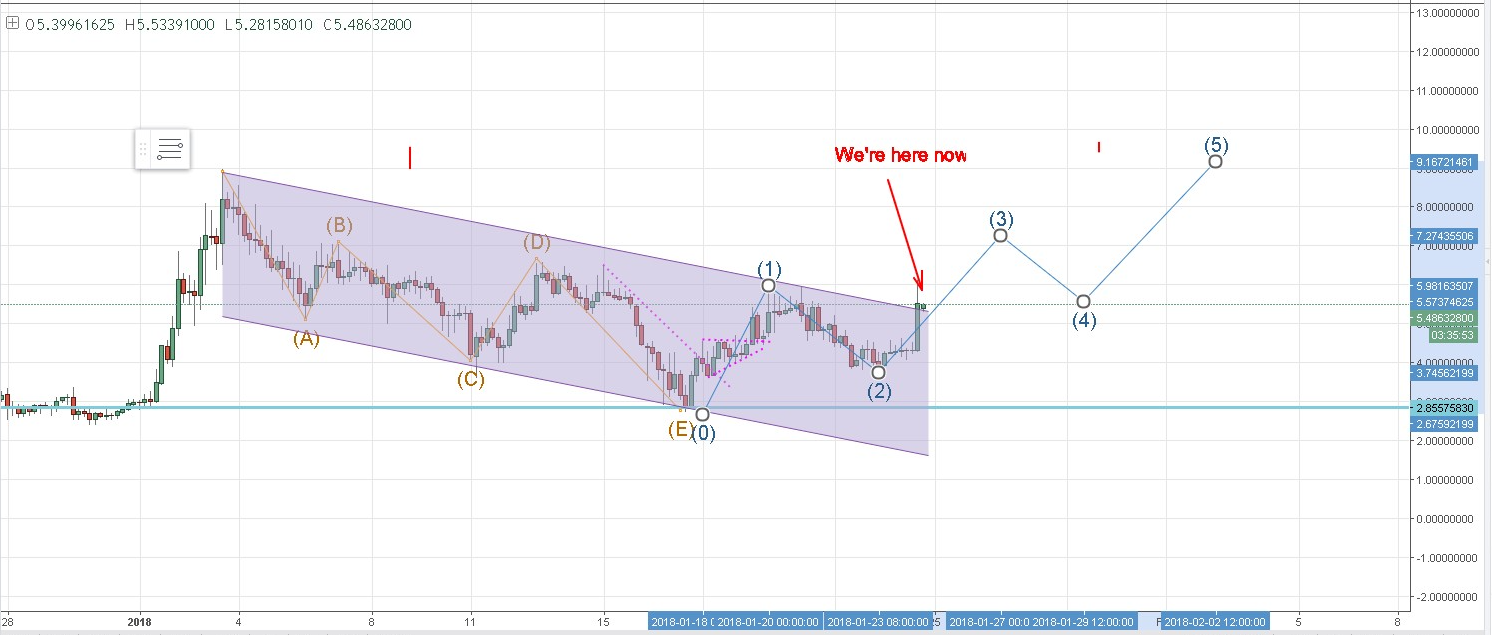 DISCLAIMER: I'm not a financial adviser, nor a professional trader and nothing I say here is meant to be a recommendation to buy or sell any financial instrument. It is purely for educational purposes. Don't invest money you can't afford to lose. Always do your own due diligence before trading or investing.