Candlestick Pattern 3
bitcoin·@jnsantos456·
0.000 HBDCandlestick Pattern 3
Bullish Engulfing Candlestick A bullish engulfing candle pattern is formed when the price of a stock moves beyond both the high and low of the previous day range. It engulfs. Usually this sort of pattern will tell a trader the price has moved down, found some support or buying volume, and then made a bullish move back up by breaking the previous day’s high. Often this type of candle can be the signal for a sustained upward move or trend change. 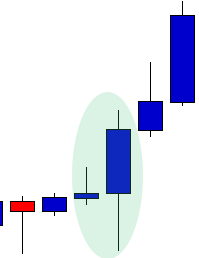 In late December, 2012 Chevron (CVX) was retracing within a newly forming trend. As it was testing lower prices, the drop was sharply rejected to the upside, forming the bullish engulfing pattern. This signaled a new leg of the upward trend and created a higher low. As we can see, price continued up into the early months of 2013. 
👍 jnsantos456,