🐳 @bellyrub powered up to a $250 vote value! Is this the start of a shake-up? 🐳
upvotebotreport·@miniature-tiger·
0.000 HBD🐳 @bellyrub powered up to a $250 vote value! Is this the start of a shake-up? 🐳
 --- **@bellyrub powered up to 2.6m Steem Power on the night before Halloween. At current prices that's around $250 available in upvotes for each auction window! More than enough to propel your post onto the main hot page or even the trending page of Steemit. How did users react? We have all the analysis from the first full day of auctions at this supersized level.** *You can read all about the increase in @bellyrub size in the official announcement <a href="https://steemit.com/bellyrub/@bellyrub/your-favorite-belly-rubber-now-has-2-686-735-sp-amazing-min-has-been-raised-to-1-sbd"> here</a>.* ---  ### @BELLYRUB ANALYSIS: HALLOWEEN 2017! ### Returns for each auction window The increase from $20 to $250 for each @bellyrub auction windows is huge. It doubles the size of the auction bot market *(this does not include the market share of @minnowbooster and @randowhale)*. Is there enough demand to fill such large auctions? Or did the returns go through the roof? Where did the additional demand come from? We start by looking at the returns for the nine windows on Tuesday. Here's the detailed data on the scatterchart. The crosses are the average returns for the window, where return is defined as "upvote value / transfer" with no deduction for the curation 25% *(since the impact varies for each upvote)*. Each individual bid is colour coded by size, demonstrating the slight variations in return that arise from the "thresholds" in the Steem voting system and the additional return that sometimes can be found on small bids. 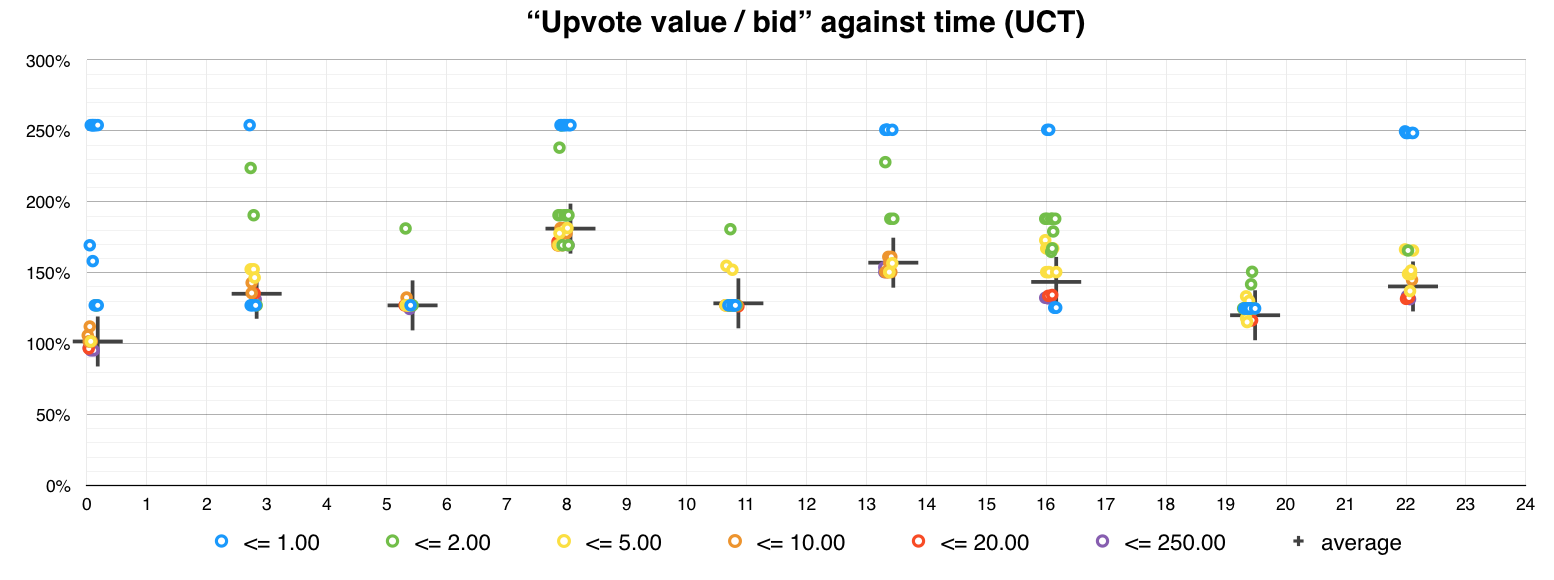 The largest average return of 181% is found in the fourth window (5.30 - 8.00 am UTC). The smallest of 101% is from the first window (which ended at one minute past midnight on the previous day). As can be seen larger bidders may have received slightly less than these averages, smaller users sometimes substantially more (but on small amounts). --- ### Bid volumes and sizes The returns are generally respectable but it's clear that demand has increased to fill the additional upvote supply. Where has this demand come from? We turn to the transfer numbers next to examine whether we're looking at an increase in users or a rise in bid size. For the eight windows prior to the power up (on 30 October) the average number of users per window was 12. For the 31 October this average rose to 25. Just over double. But nowhere near enough to cover the ten-fold increase in capacity. So there must also be an increase in bid size. This is clear from the charts below: firstly we show transfer amounts for 30 October (excluding the last window which was after the power up) and then underneath the same chart for 31 October. 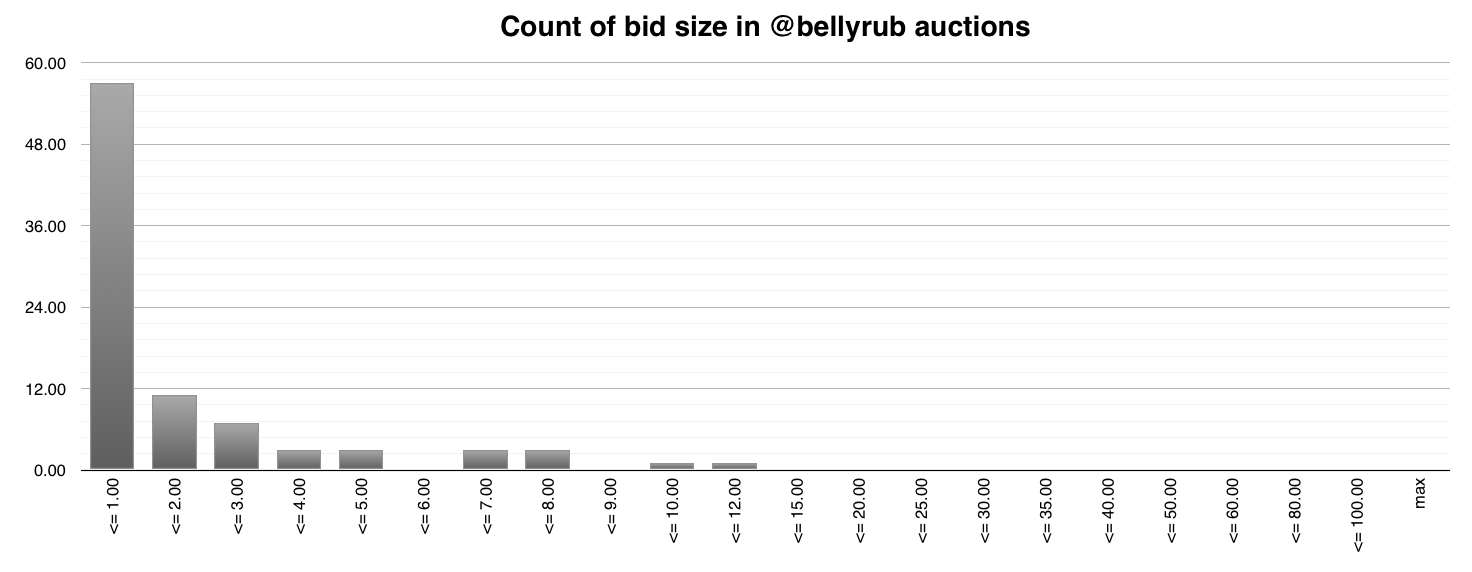  There are some huge bids on that second chart. Two in the $60-$80 range, one in the $80-$100 range, and one at over $100! --- ### Top 10 bids and top 10 users Exactly how large was that $100+ bid? We show the top 10 bids for 31 October in the table below. The ratios quoted are prior to any deduction for curation. ||User|Transfer Amount|Upvote Amount|Upvote / Transfer Ratio| |:-----:|:-----:|:-----:|:-----:|:-----:| |1|@earthnation|139|183|132%| |2|@faces|90|105|117%| |3|@earthnation|70|92|131%| |4|@zombee|68|66|97%| |5|@mrbenbutton|56|53|95%| |6|@zeartul|50|62|124%| |7|@itchykitten|40|38|95%| |8|@contentjunkie|40|53|133%| |9|@zeartul|40|60|150%| |10|@humptydumpty1|36|48|133%| *(Note that the three bids with returns below 100% were all from the first window of the day.)* A not dissimilar table; this time the top 10 @bellyrub users by total transfer amount for 31 October. ||User|Number of Transfers|Total Transfer Amount|Total Upvote Amount|Upvote / Transfer Ratio| |:-----:|:-----:|:-----:|:-----:|:-----:|:-----:| |1|@earthnation|2|209|275|132%| |2|@faces|3|105|121|115%| |3|@mrbenbutton|3|103|113|110%| |4|@zeartul|2|90|122|136%| |5|@zombee|1|68|66|97%| |6|@lexiconical|3|60|95|158%| |7|@contentjunkie|2|58|71|122%| |8|@humptydumpty1|2|58|69|119%| |9|@ghasemkiani|6|55|80|145%| |10|@mihaisyblu|4|45|61|136%| There are some huge upvote amounts being purchased. The largest are easily enough to propel a post onto the main hot and trending pages of steemit. Is this the start of a shake-up at the top table? Or the descent of steemit into a hell papered with poor quality articles boosted by those with the ready money to spend? No doubt we'll see plenty of articles on this debate in the coming few days. --- ### Transfer timing Finally a look at the timing of transfers. There's quite a lot of action at the end of auction windows these days. Here's the fourth (and most profitable) window on Halloween showing a rush of bids to grab some of the action in the last 10 minutes (each column is a 10 minute period; each bid is a different colour). 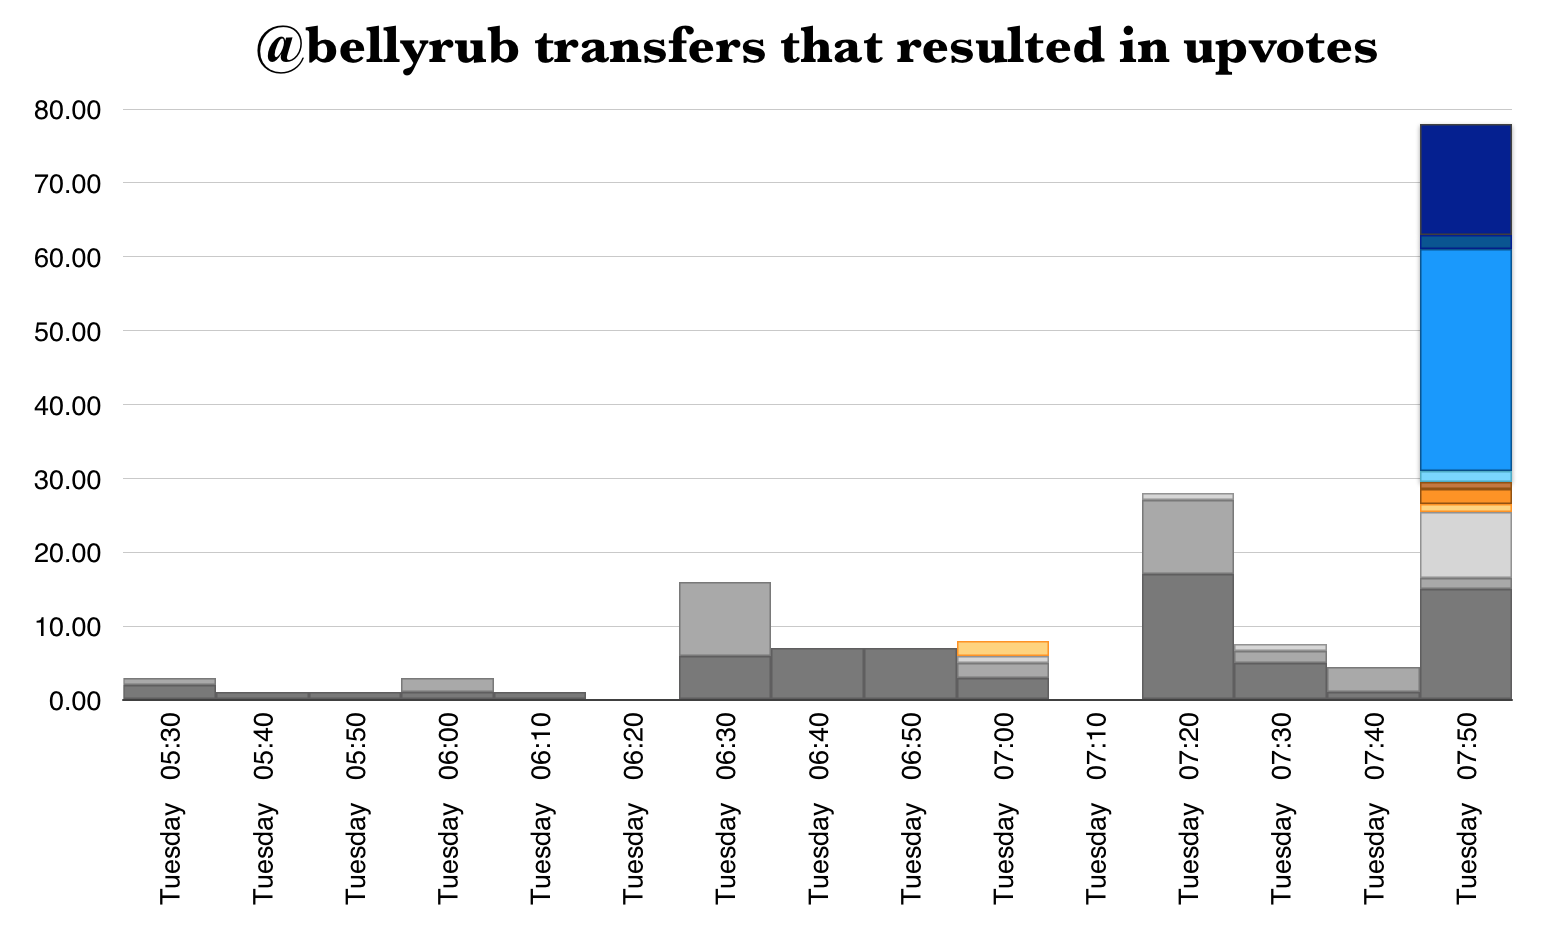 For those on the search for high returns it's worth noting that this kind of action is likely in the last twenty minutes of profitable windows. Please be aware of the risks and rules before using any auction bot. ---  ### Reminders At the end of the day, the key things to focus on are the quality of your posts and your engagement with the community. In the long run, these will determine your rewards on Steemit. The main purpose of upvote bots is to give your work visibility. Getting your beautifully crafted post launched onto the hot list or the trending list can help to get it seen by more people who may share your interests. The "value-for-money" is far from the main story. Please remember that the returns from upvote-bots are not guaranteed. Your post may receive less of an upvote than the SBD you have bid. ### Back issues You can check out all our back issues in @miniature-tiger or the #upvotebotreport tag. --- *This report relies on the data in sql.steemsql.com, a fantastic tool run by @arcange. As always, many thanks for making this available!* <center></center>