February 2, 2022 Bitcoin Technical Analysis
hive-167922·@muratkbesiroglu·
0.000 HBDFebruary 2, 2022 Bitcoin Technical Analysis
 Bitcoin's total market cap still accounts for 41% of the crypto market's total cap. Despite its market share weight of less than fifty percent, Bitcoin prices are of interest to anyone who has invested in crypto, as it influences the direction of the whole market. 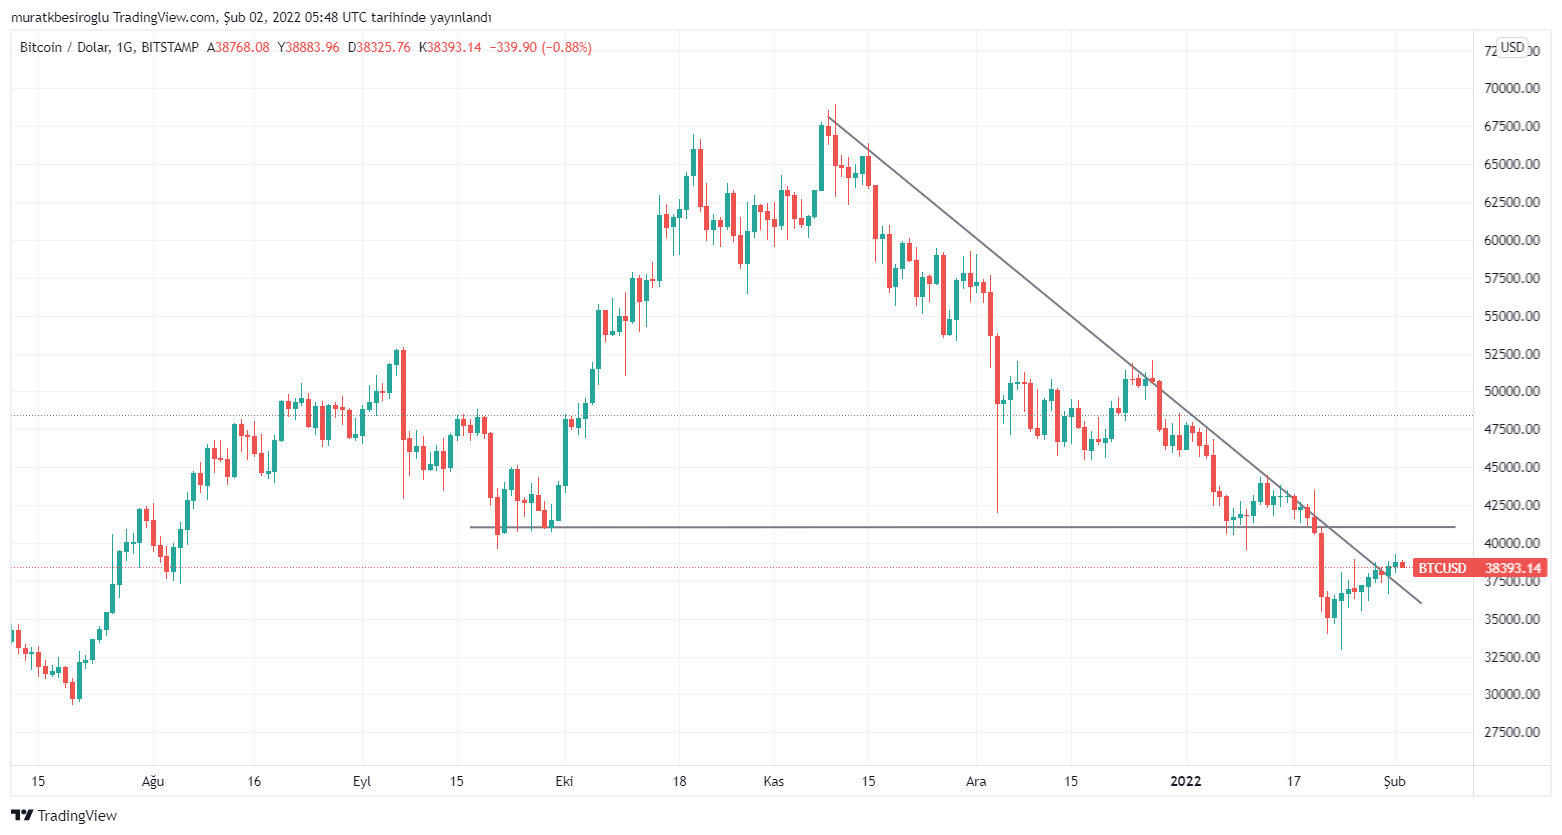 The crypto market has been in a downtrend since November 9. We can clearly see this trend in the Bitcoin price chart above. The horizontal line seen in the chart is the resistance of 41k, which was broken on January 20. As of January 20, prices had decreased rapidly to 35 thousand. In fact, we saw that it dropped to 32 thousand during the day. In the last 10 days, we have witnessed a slight increase in prices. Two days ago we saw a close above the trendline on the daily chart for the first time. No doubt this is a good sign, but a multi-faceted analysis is needed to determine whether the uptrend will continue. Thus, we can predict how traders from different schools perceive the market. # **Candlestick Pattern Analysis** 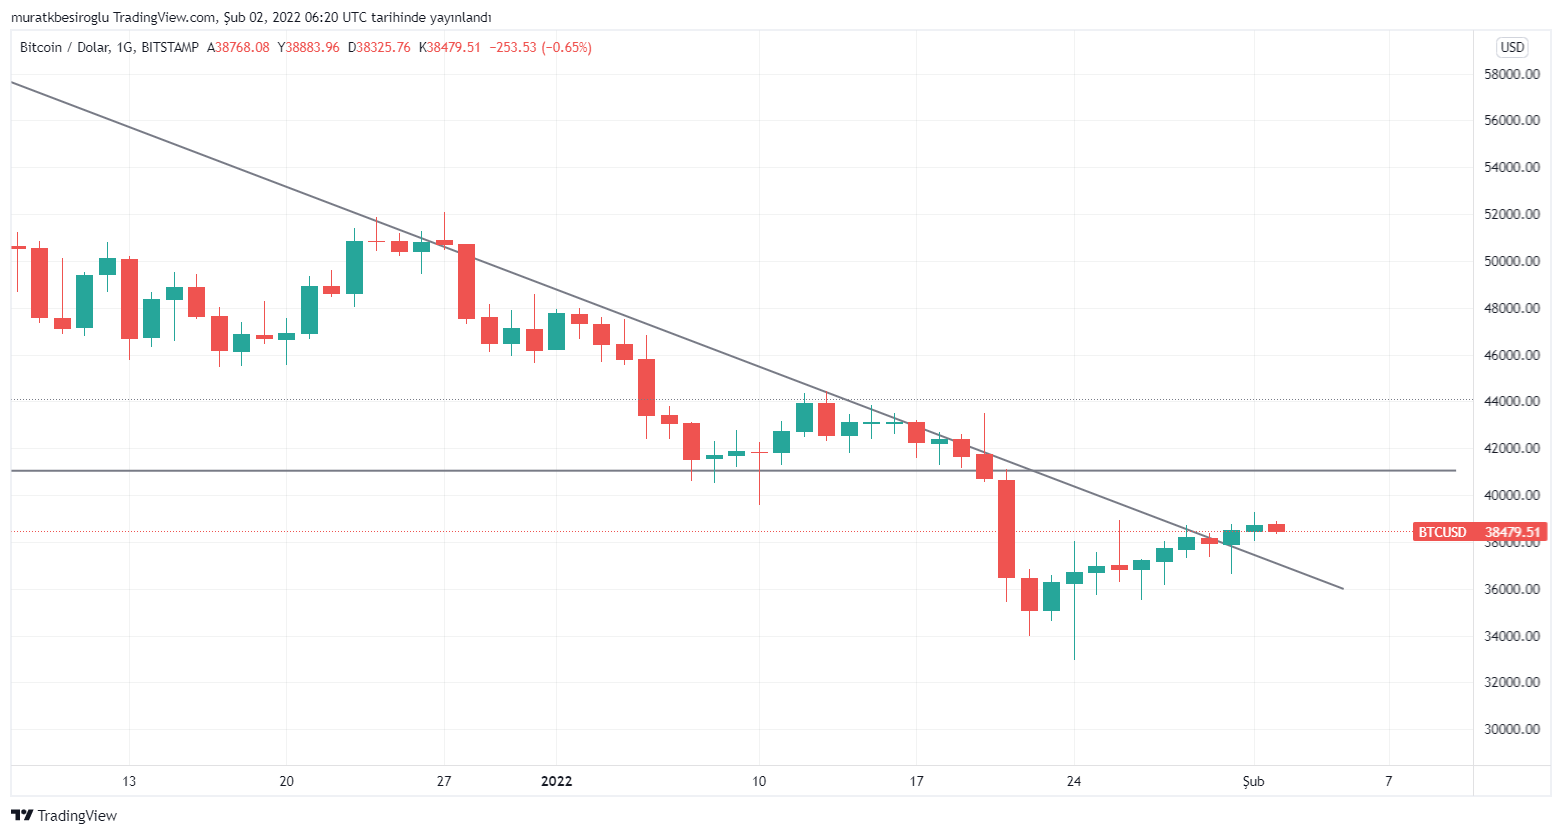 When we look closely at the Bitcoin daily price chart, the red candles that show the decreases on January 20 and 21 draw attention. The effect of these candles, which shows the price movement below the 41k resistance has not been neutralized. A long wick was formed at the bottom of the candlestick, which shows the price action on January 24, which gave rise to hopes that the decline could stop. The wicks formed under the candles of the following days can be interpreted positively. We need to see a long green candle in the coming days so that the belief that the uptrend will be permanent becomes stronger. # **Multi Time Frame Analysis** We have made the comments so far on the daily charts. By looking at the 4-hour chart, we can see the details of what has been happening in the market in the last few days. 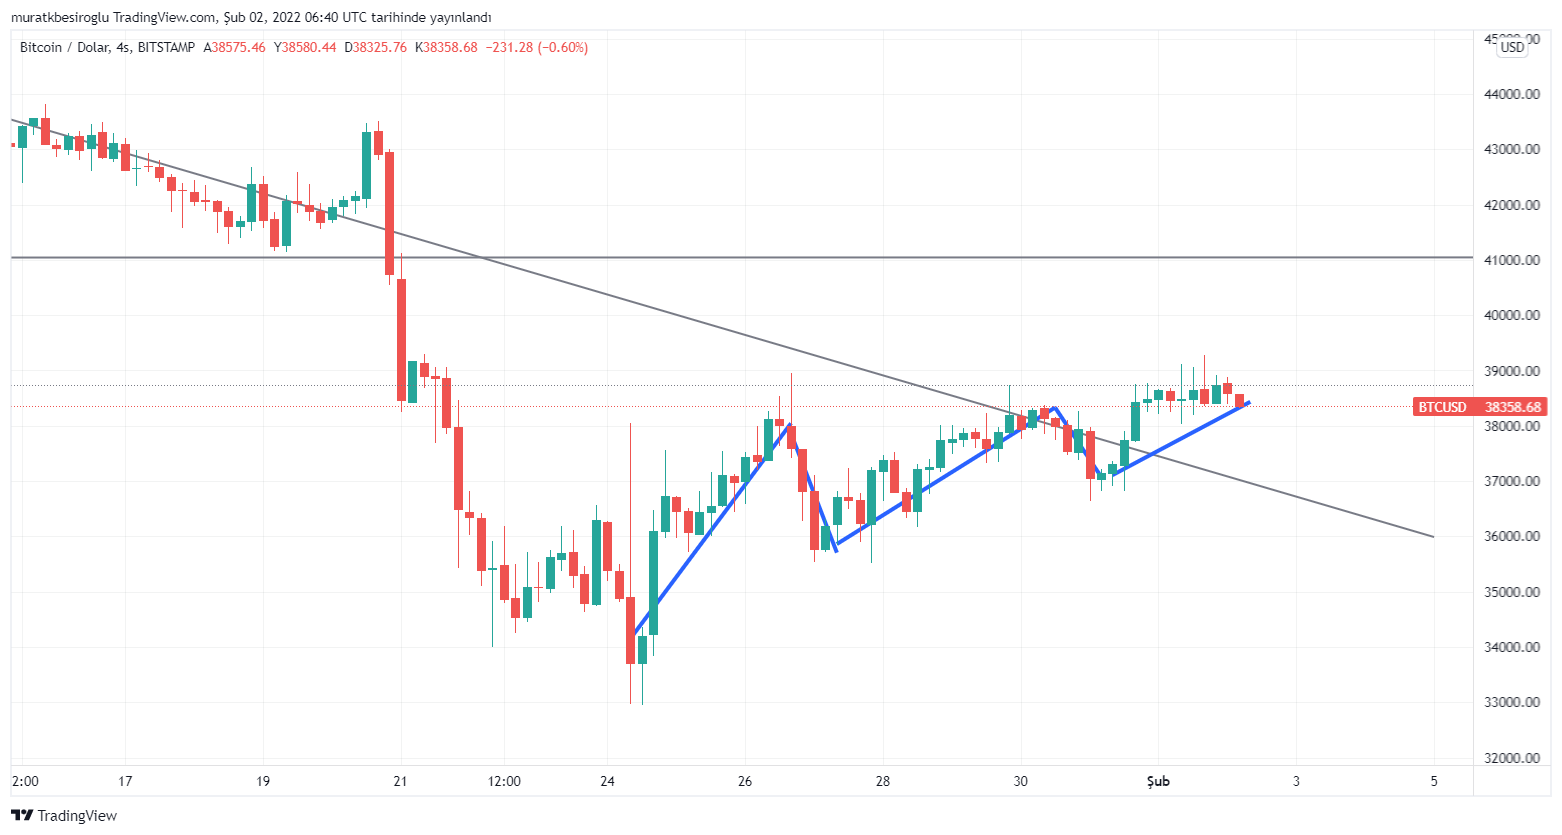 When we take a closer look at the chart, we see an uptrend consisting of higher highs and higher lows. After closing above the downtrend line, a relatively long green candle was formed. However, there is a horizontal view on the last 9 candlesticks. # **Momentum** We see the latest status of the MACD and RSI indicators, which measure the momentum created by price movements, in the chart below. Ideally, we would expect the RSI to be above 50 so that we can talk about an uptrend. However, the RSI is still at 43. On the other hand, MACD gave a 'buy' signal on the daily chart 2 days ago and is still in the positive zone. 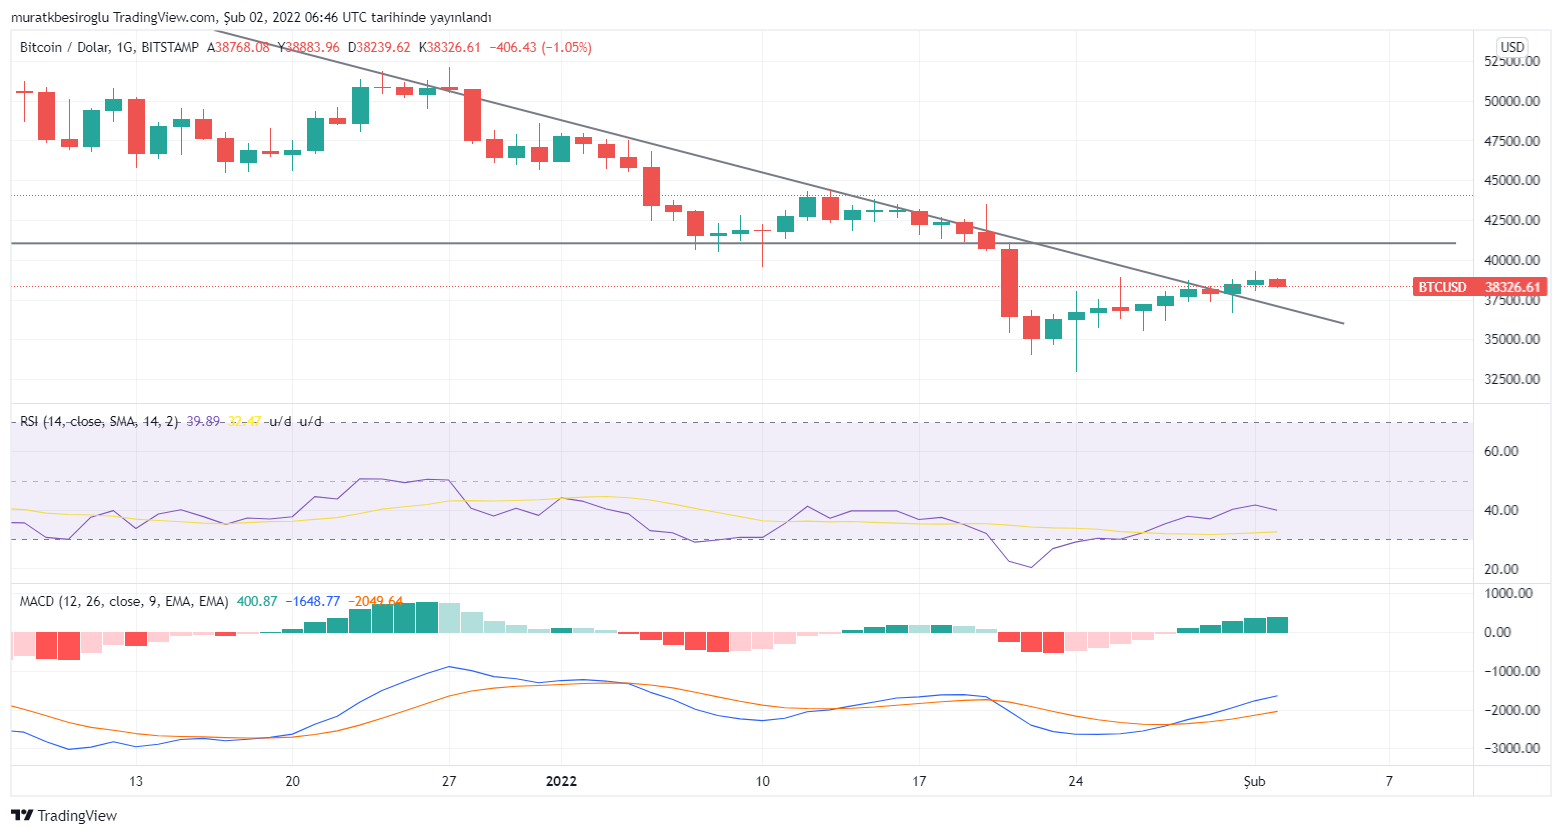 # **Support and Resistance Levels** The support level is at 35k. We see that the resistance level is at 41k. If we can close above 41k, we can see that the purchases accelerate. # **Moving Averages** Currently, Bitcoin price is hovering below the 20, 50, 100, and 200-day exponential moving averages. As can be seen in the chart below, the downtrend became evident when the 20-day EMA, shown in red, was breached. We are very close to the 20-day EMA. Passing this level can be perceived as positive. 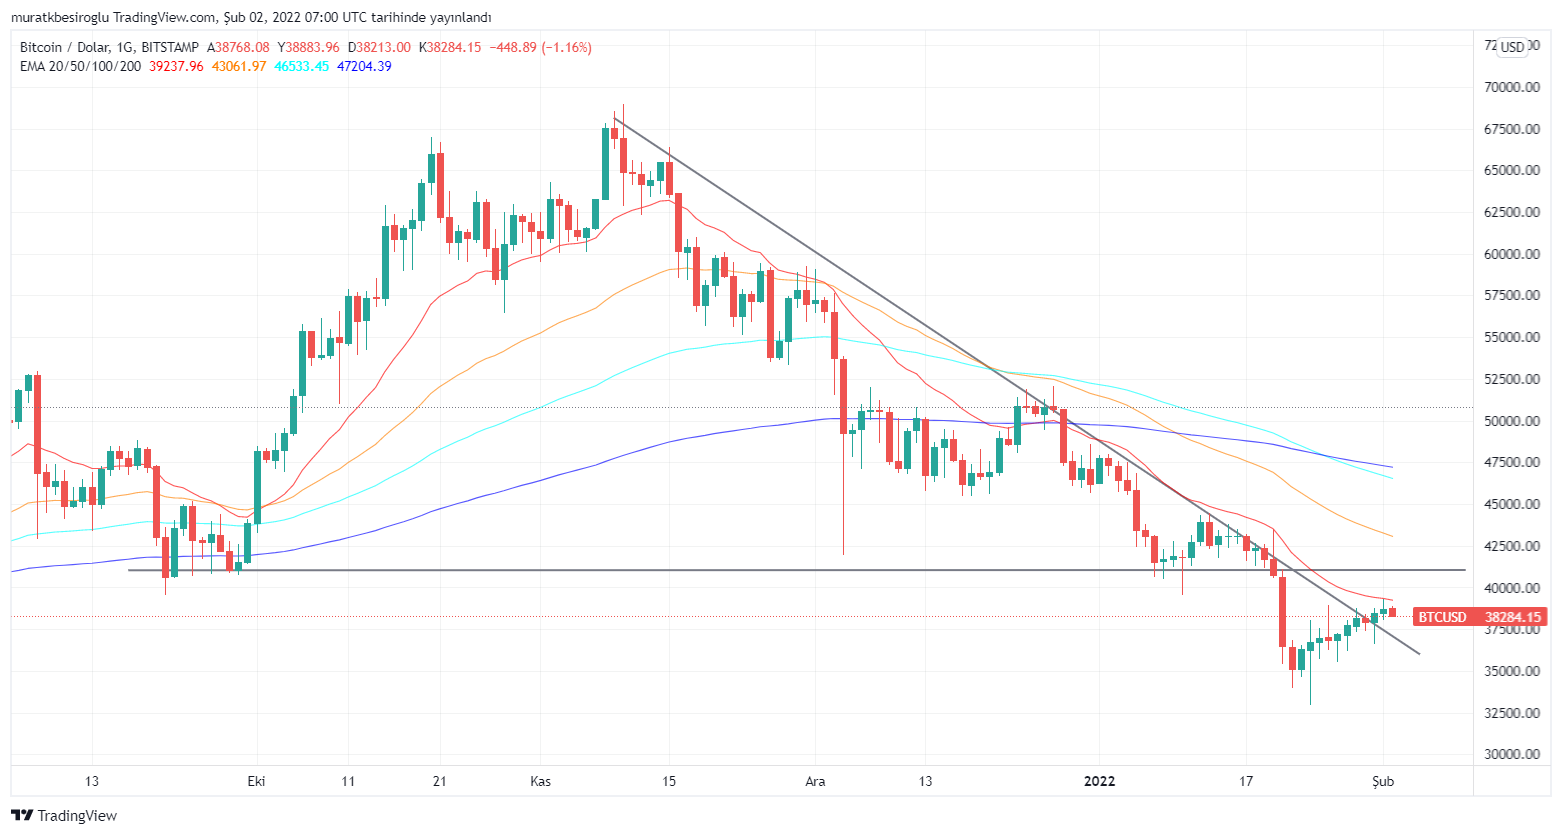 # **Trading Volume** In the image below, we see the price chart at the top, the development of the daily trading volume in the second place, the volume flow index in the third place and the time segmented volume in the fourth place. All three indicators show that the rises in the last 10 days are not supported by strong volume. 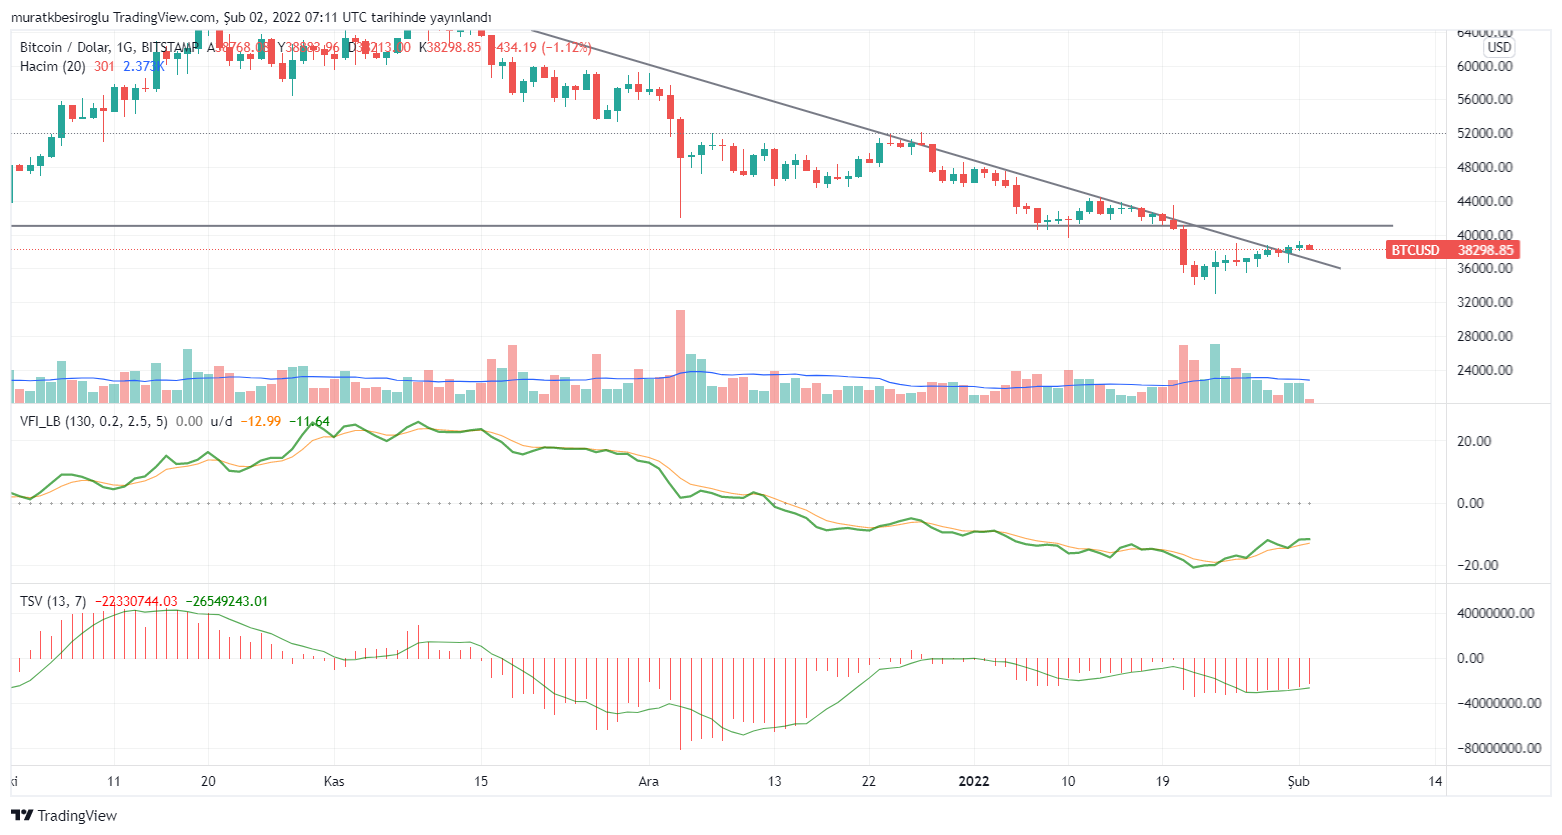 # **Fibonacci Analysis** Fibonacci analysis is used to predict the amount of reaction buying or selling after an uptrend or downtrend. The most common scenario is for prices to move between 50% and 61.8% in the opposite direction of the previous trend. If the end of the downtrend is confirmed by the price passing the 41k level, the Bitcoin price may rise to the 51k-55k range easily. # **Conclusion** In summary, we need to witness a close above the 41k level to decide that the downtrend is over. In this case, the 41k resistance will become support again and the 20-day EMA will be surpassed. Especially if this rise is supported by high volume, the uptrend will start with high momentum. So what is the probability of crossing the level of 41k? Indeed, the indicators represent a rather complex course. If I had to give a probability, I would say 51%. A close above the downtrend line is a good sign. Currently, the MACD indicator showing the momentum and the half trend indicator showing the trend reversals are giving a 'buy' signal.  Thank you for reading. **Note:** As I am not a financial adviser, you better do your own research. **Image Sources:** https://www.tradingview.com/ and https://giphy.com/
👍 joeyarnoldvn, jumbot, mehmetfix, coinmeria, agememnon, ahmetchef, bluedwains, denizcakmak, brofund, roleerob, ahmetay, snlbaskurt, thales7, borbolet, mariuszkarowski, mmmmkkkk311, informator, ntowl, ctime, sbi8, chorock, sudefteri, akifane, kahvesizlik, vida-blanca, brofi, anadolu, cranium, bilimkurgu, ozeryilmaz, maylenasland, centtoken, craniums1, hive.curation, investegg, ph1102, cryptofiloz, russellstockley, clixmoney, geekoverdose, dcooperation, soufiani, alexabsolute, scottshots, downrighthustle, behelen, starstrings01, cowboysblog, nelsonnils, doziekash, tripode, mayorkeys, ourpick, horstman5, olatundedaniel1, voxmortis, brainpod, semihbalkanli, failingforwards, jeronimorubio, camuel, maonx, liotes.voter, seckorama, gadrian, achim03, pixiepost, liotes, theroad2freedom, txrose, familyhistory, moonthumb, happyvoter, mybiel, solymi, urri2020, piratethanos, vikbuddy, thegoliath, damla, emrebeyler, dpoll.witness, merlin7, peri, emotionalsea, gokhan83kurt, piinaar, mike-nascar, pboulet, idiosyncratic1, agathusia, oxoskva, yamtar, visionaer3003, turkiye, skgcrypto,