BTC Testing it's $9000 resistance line. Technical Analysis 4/22/18
cryptocurrency·@nightgrounds·
0.000 HBDBTC Testing it's $9000 resistance line. Technical Analysis 4/22/18
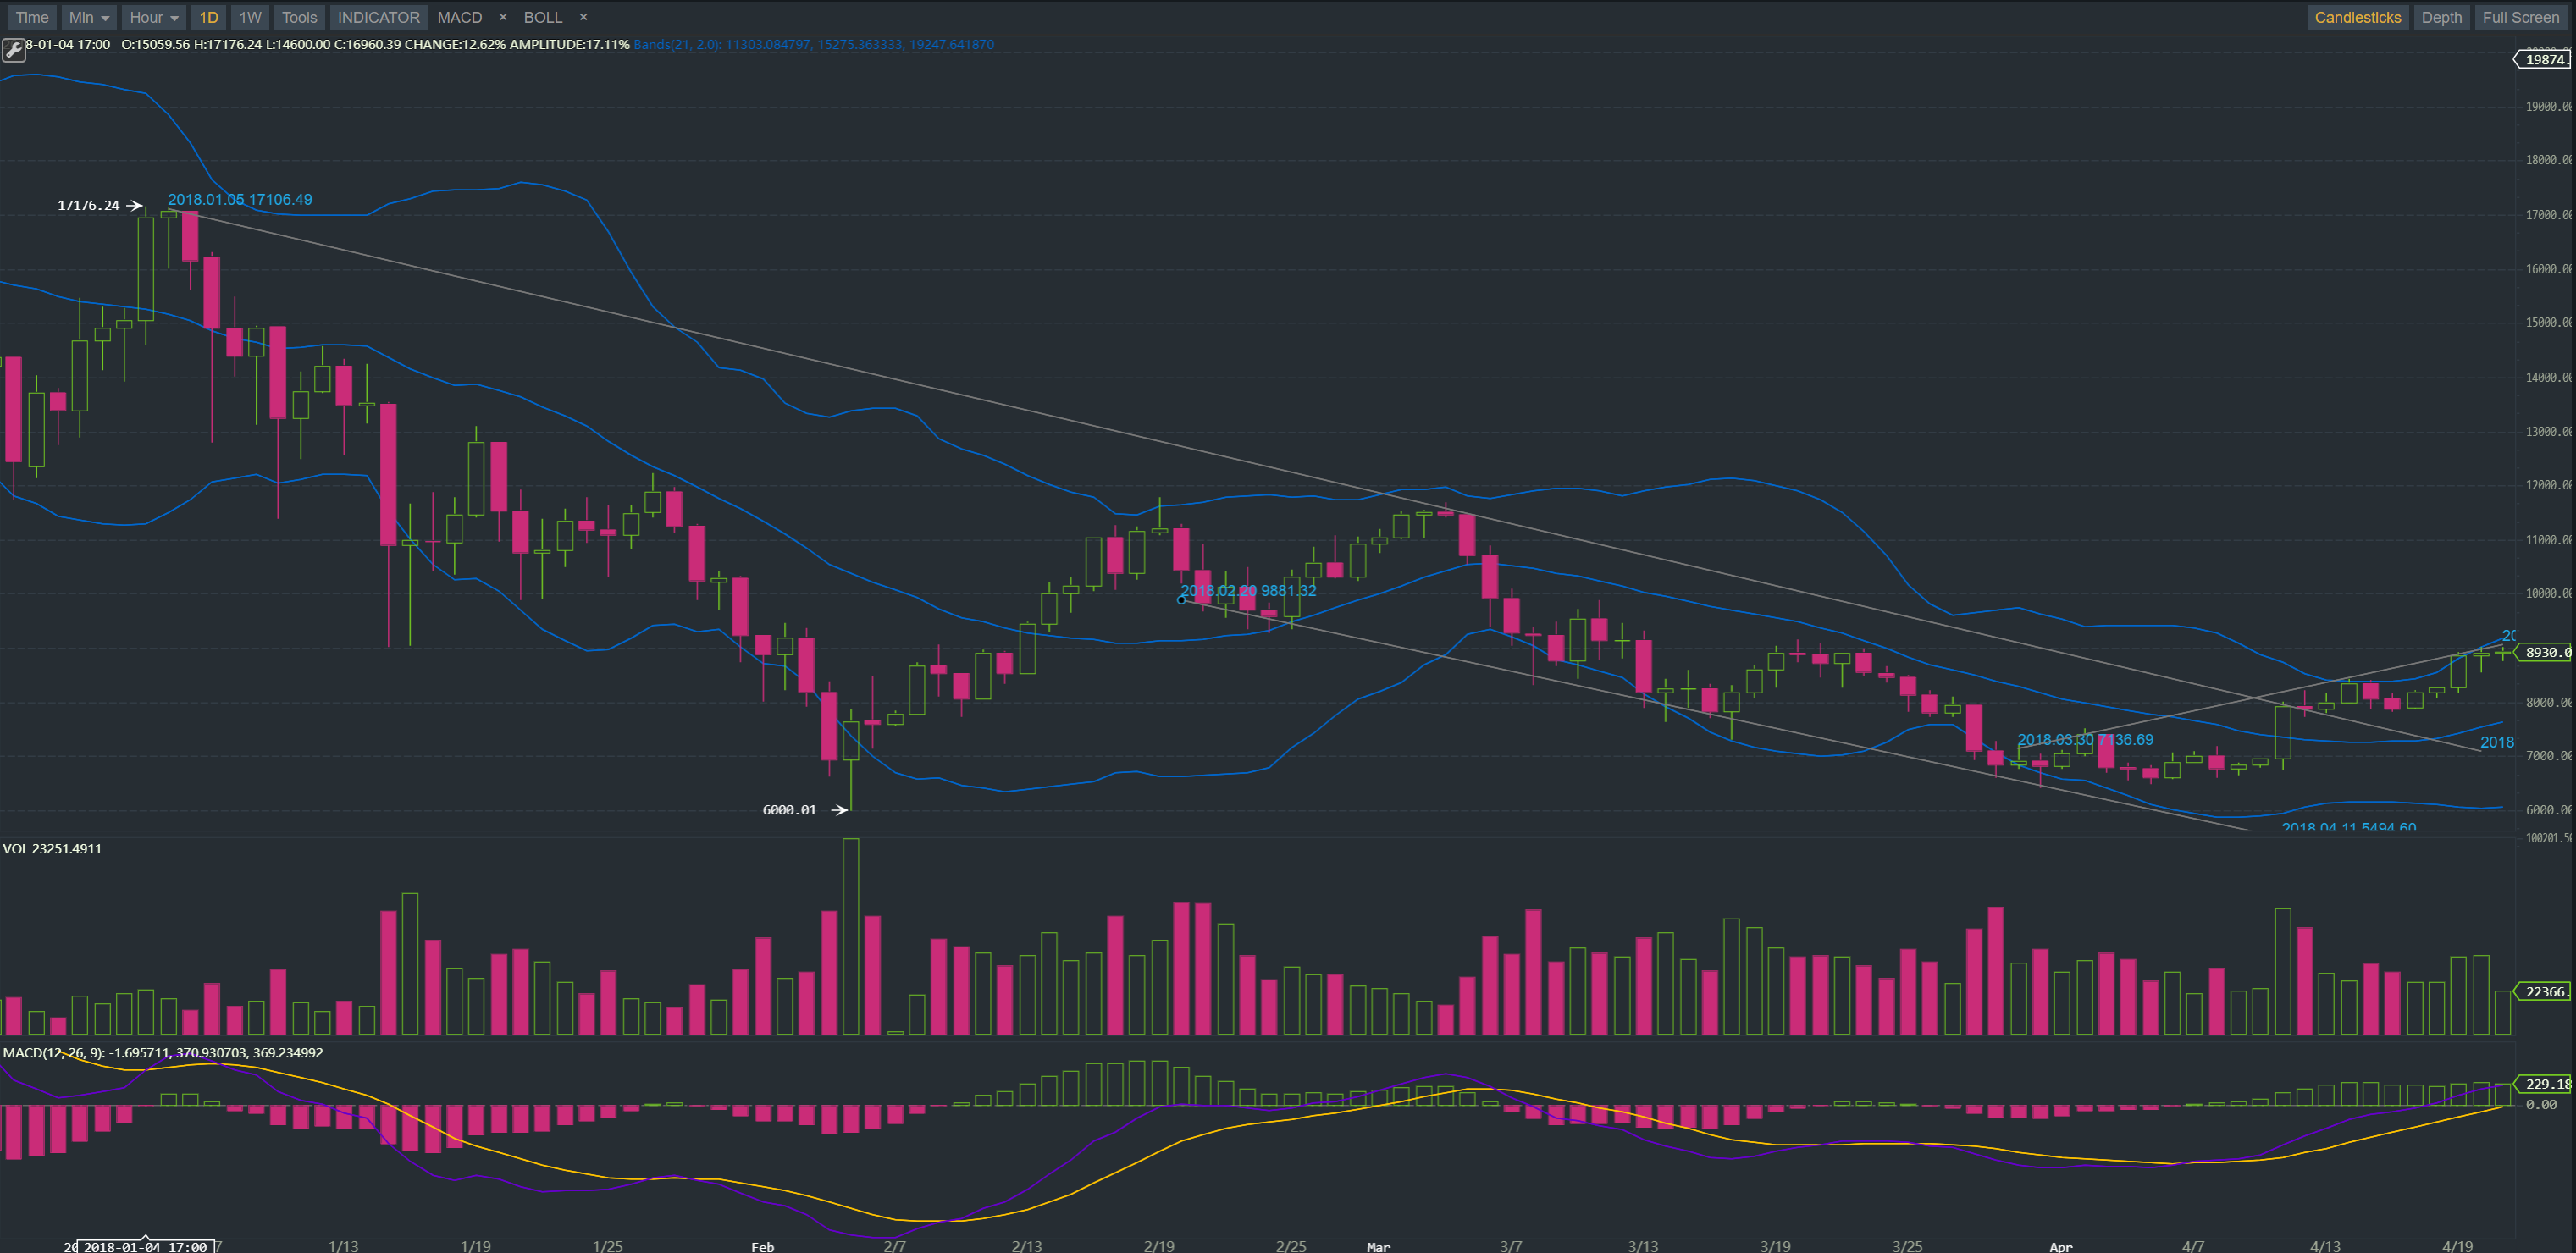
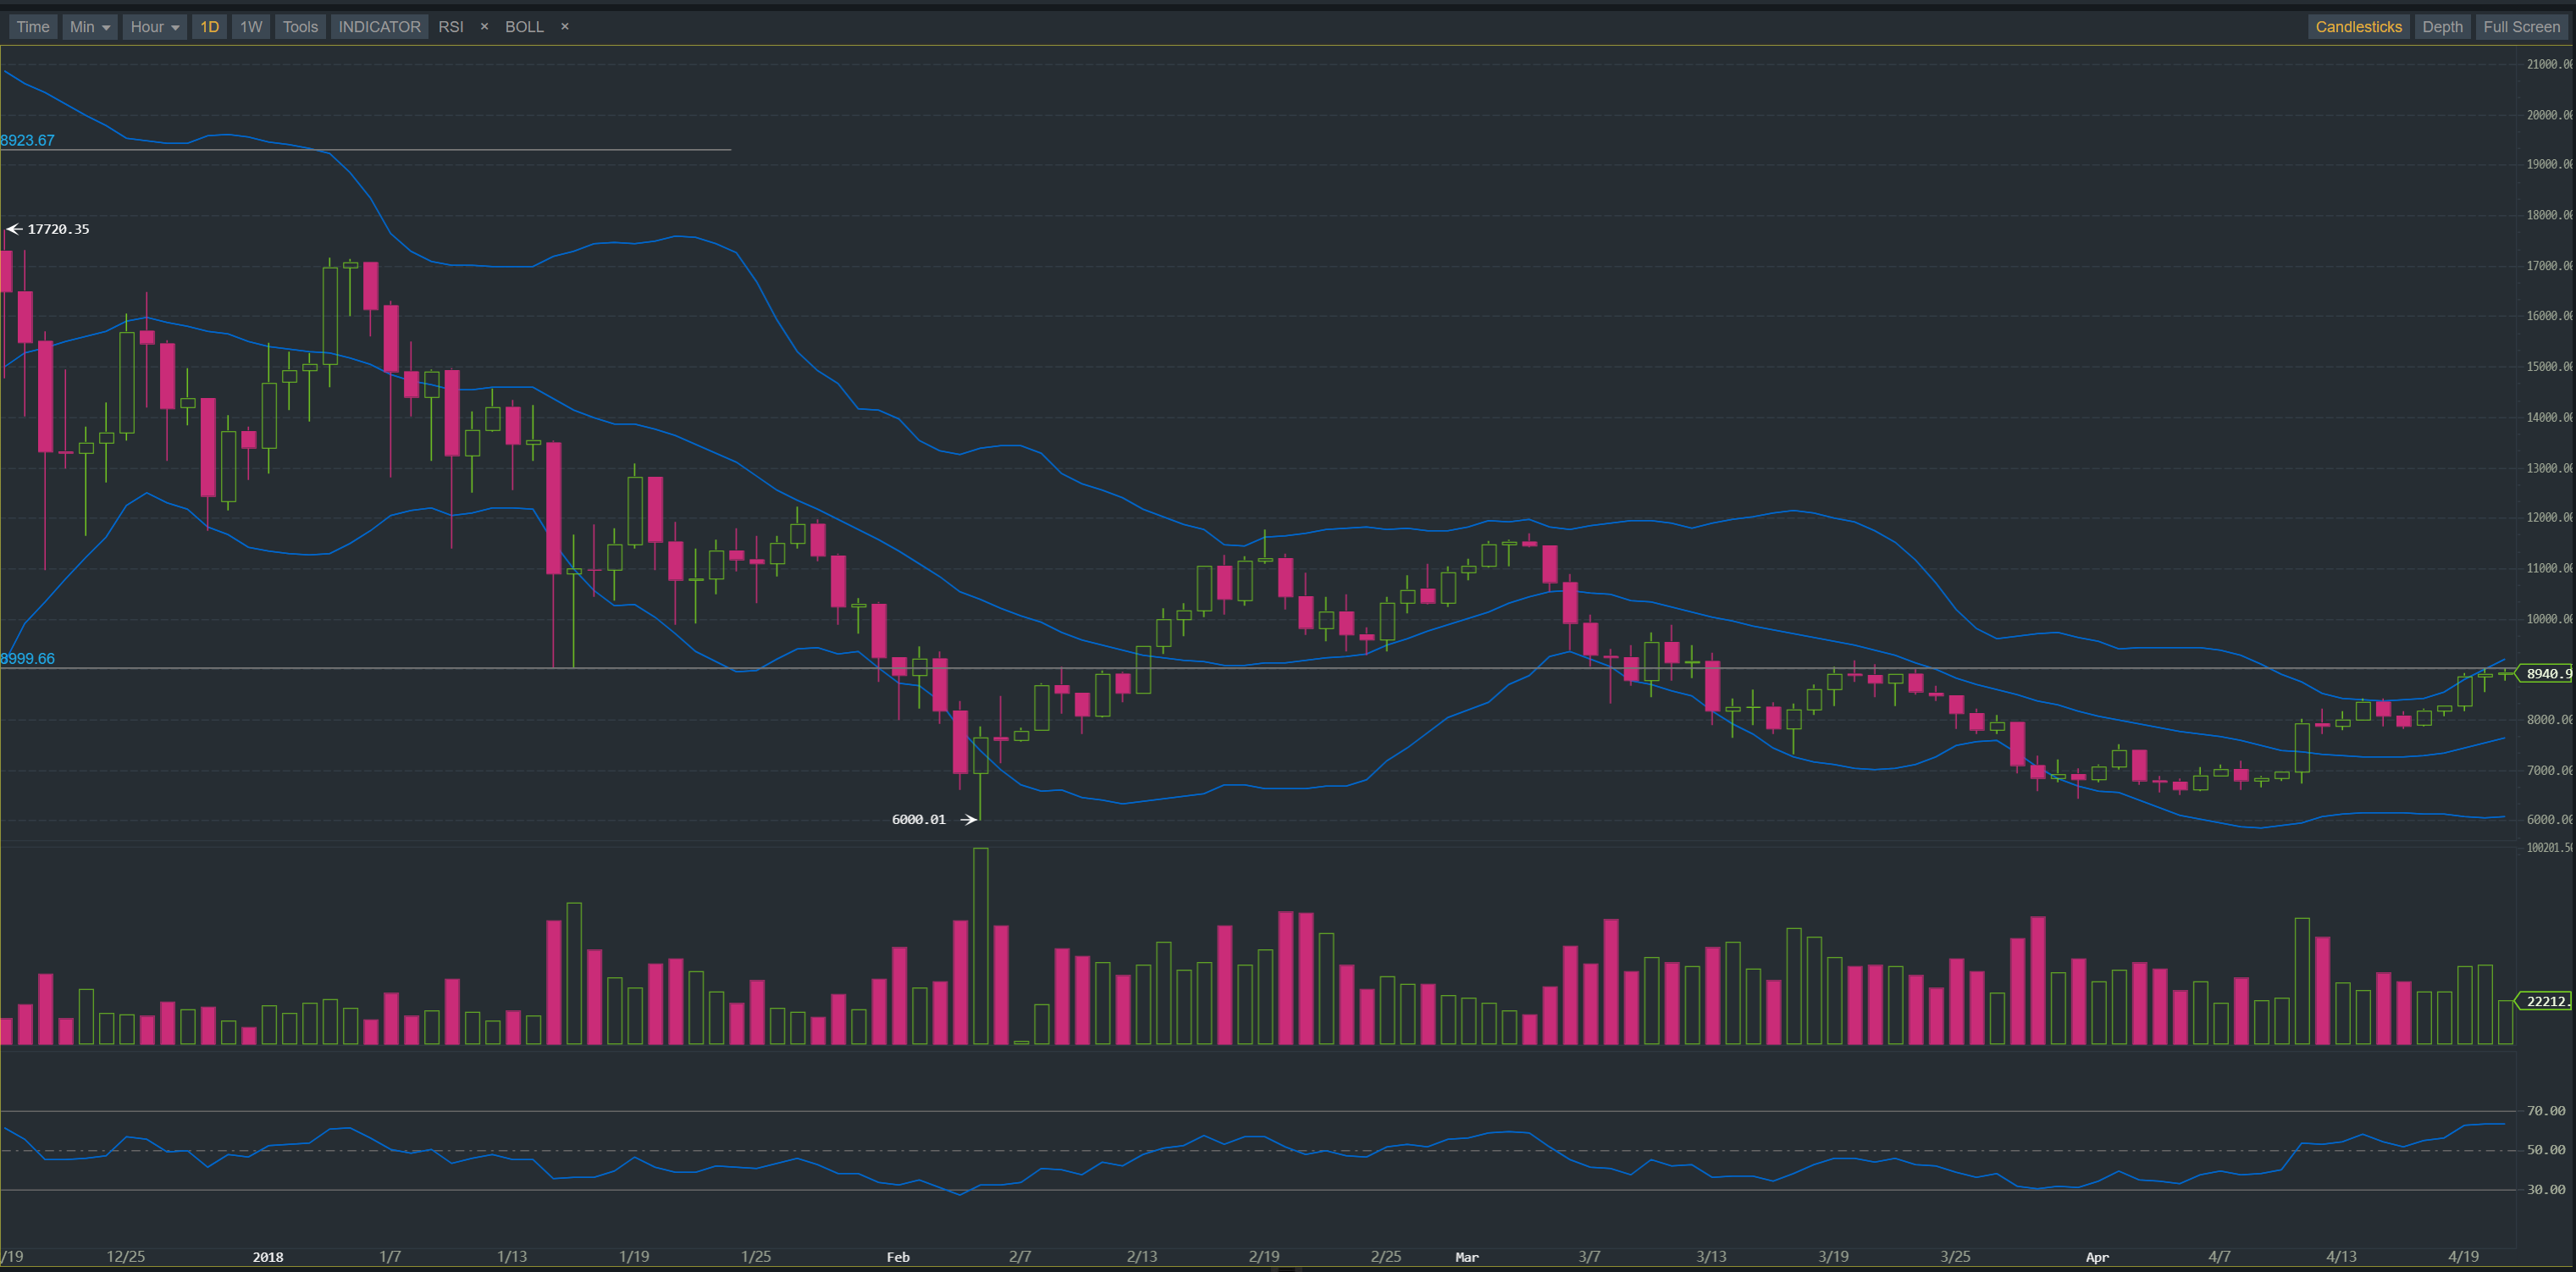 As you can see, we are currently testing a resistance line. Let's take a look at some indicators. BOLL: Right now we are following the upper bollinger band. This could either mean it will continue to follow or it will start to head the oppisite dirrection. RSI: Still going up from previous technical analysis, almost overbought. This could be a good sign though. <center> 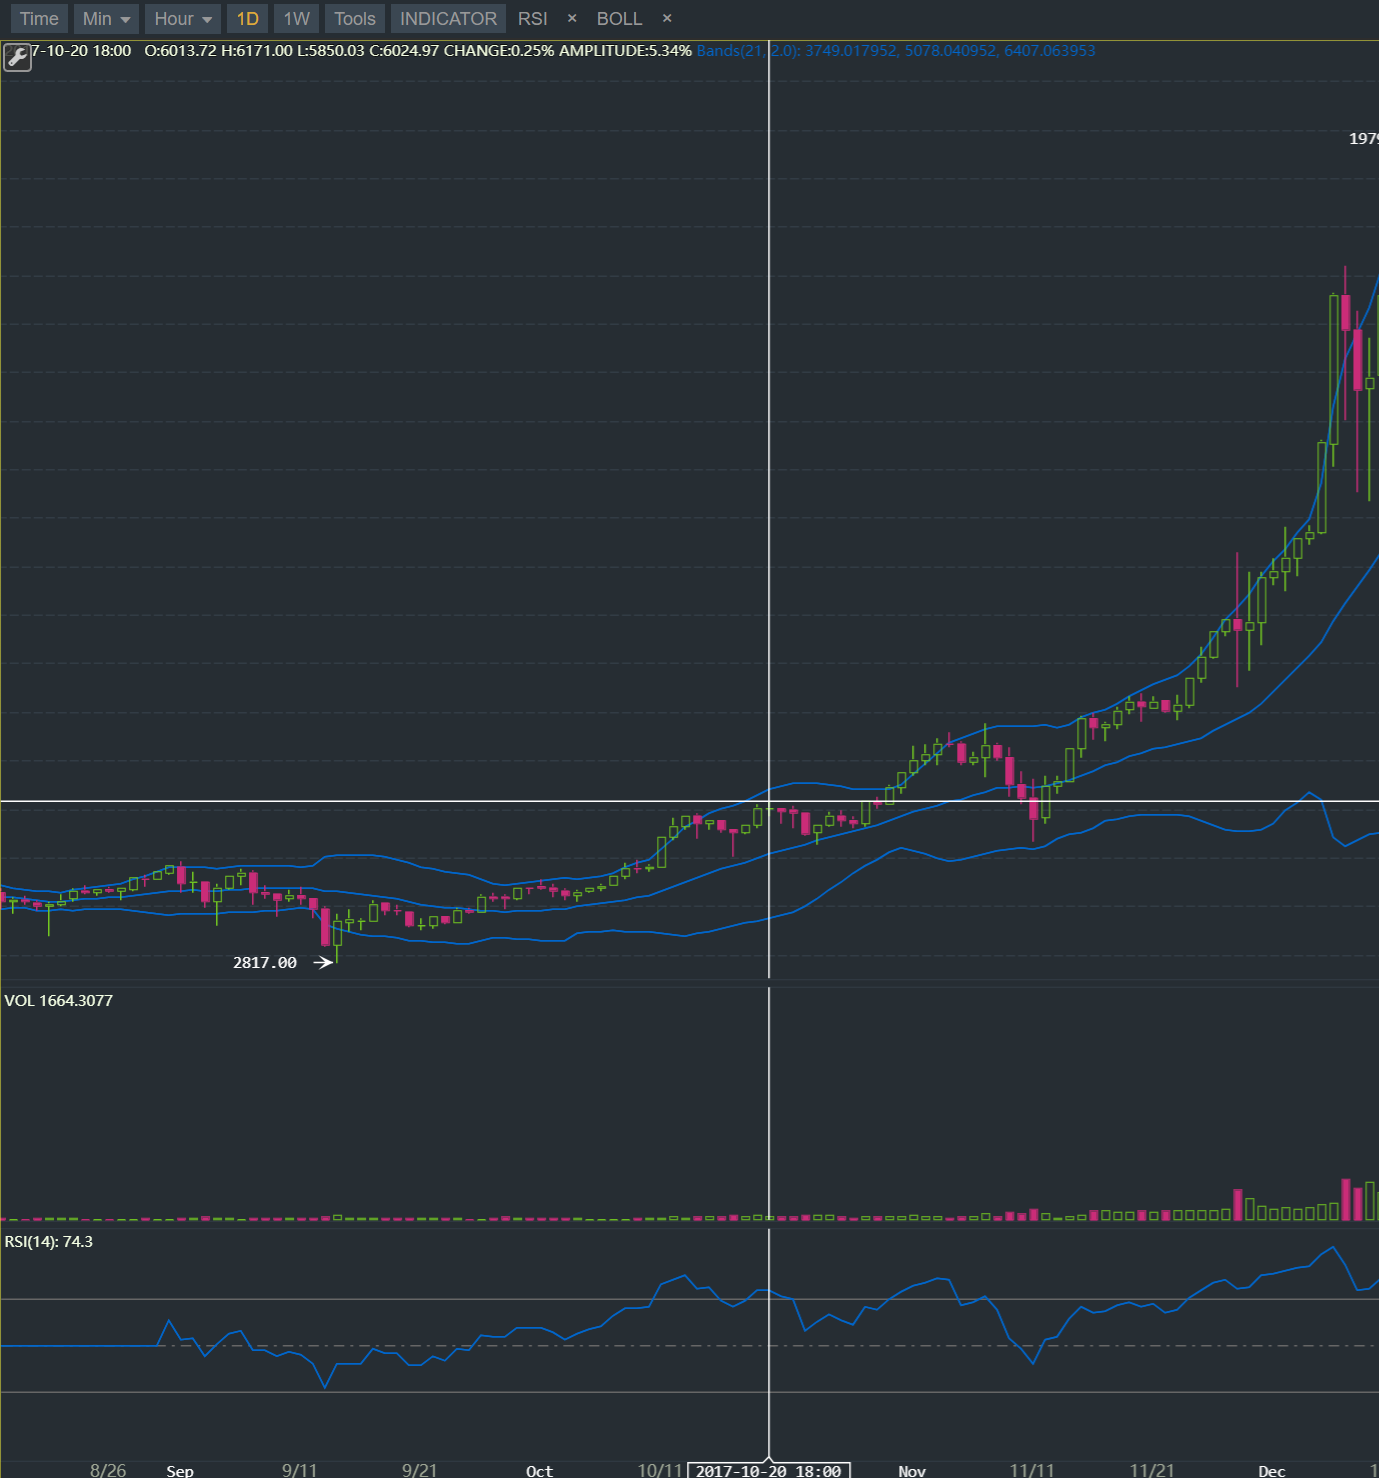 </center> See how the RSI went overbought before the breakout? This could happen again possibly using the power of patterns! StochRSI: Currently overbought, was overbought during previous time period (last screenshot) 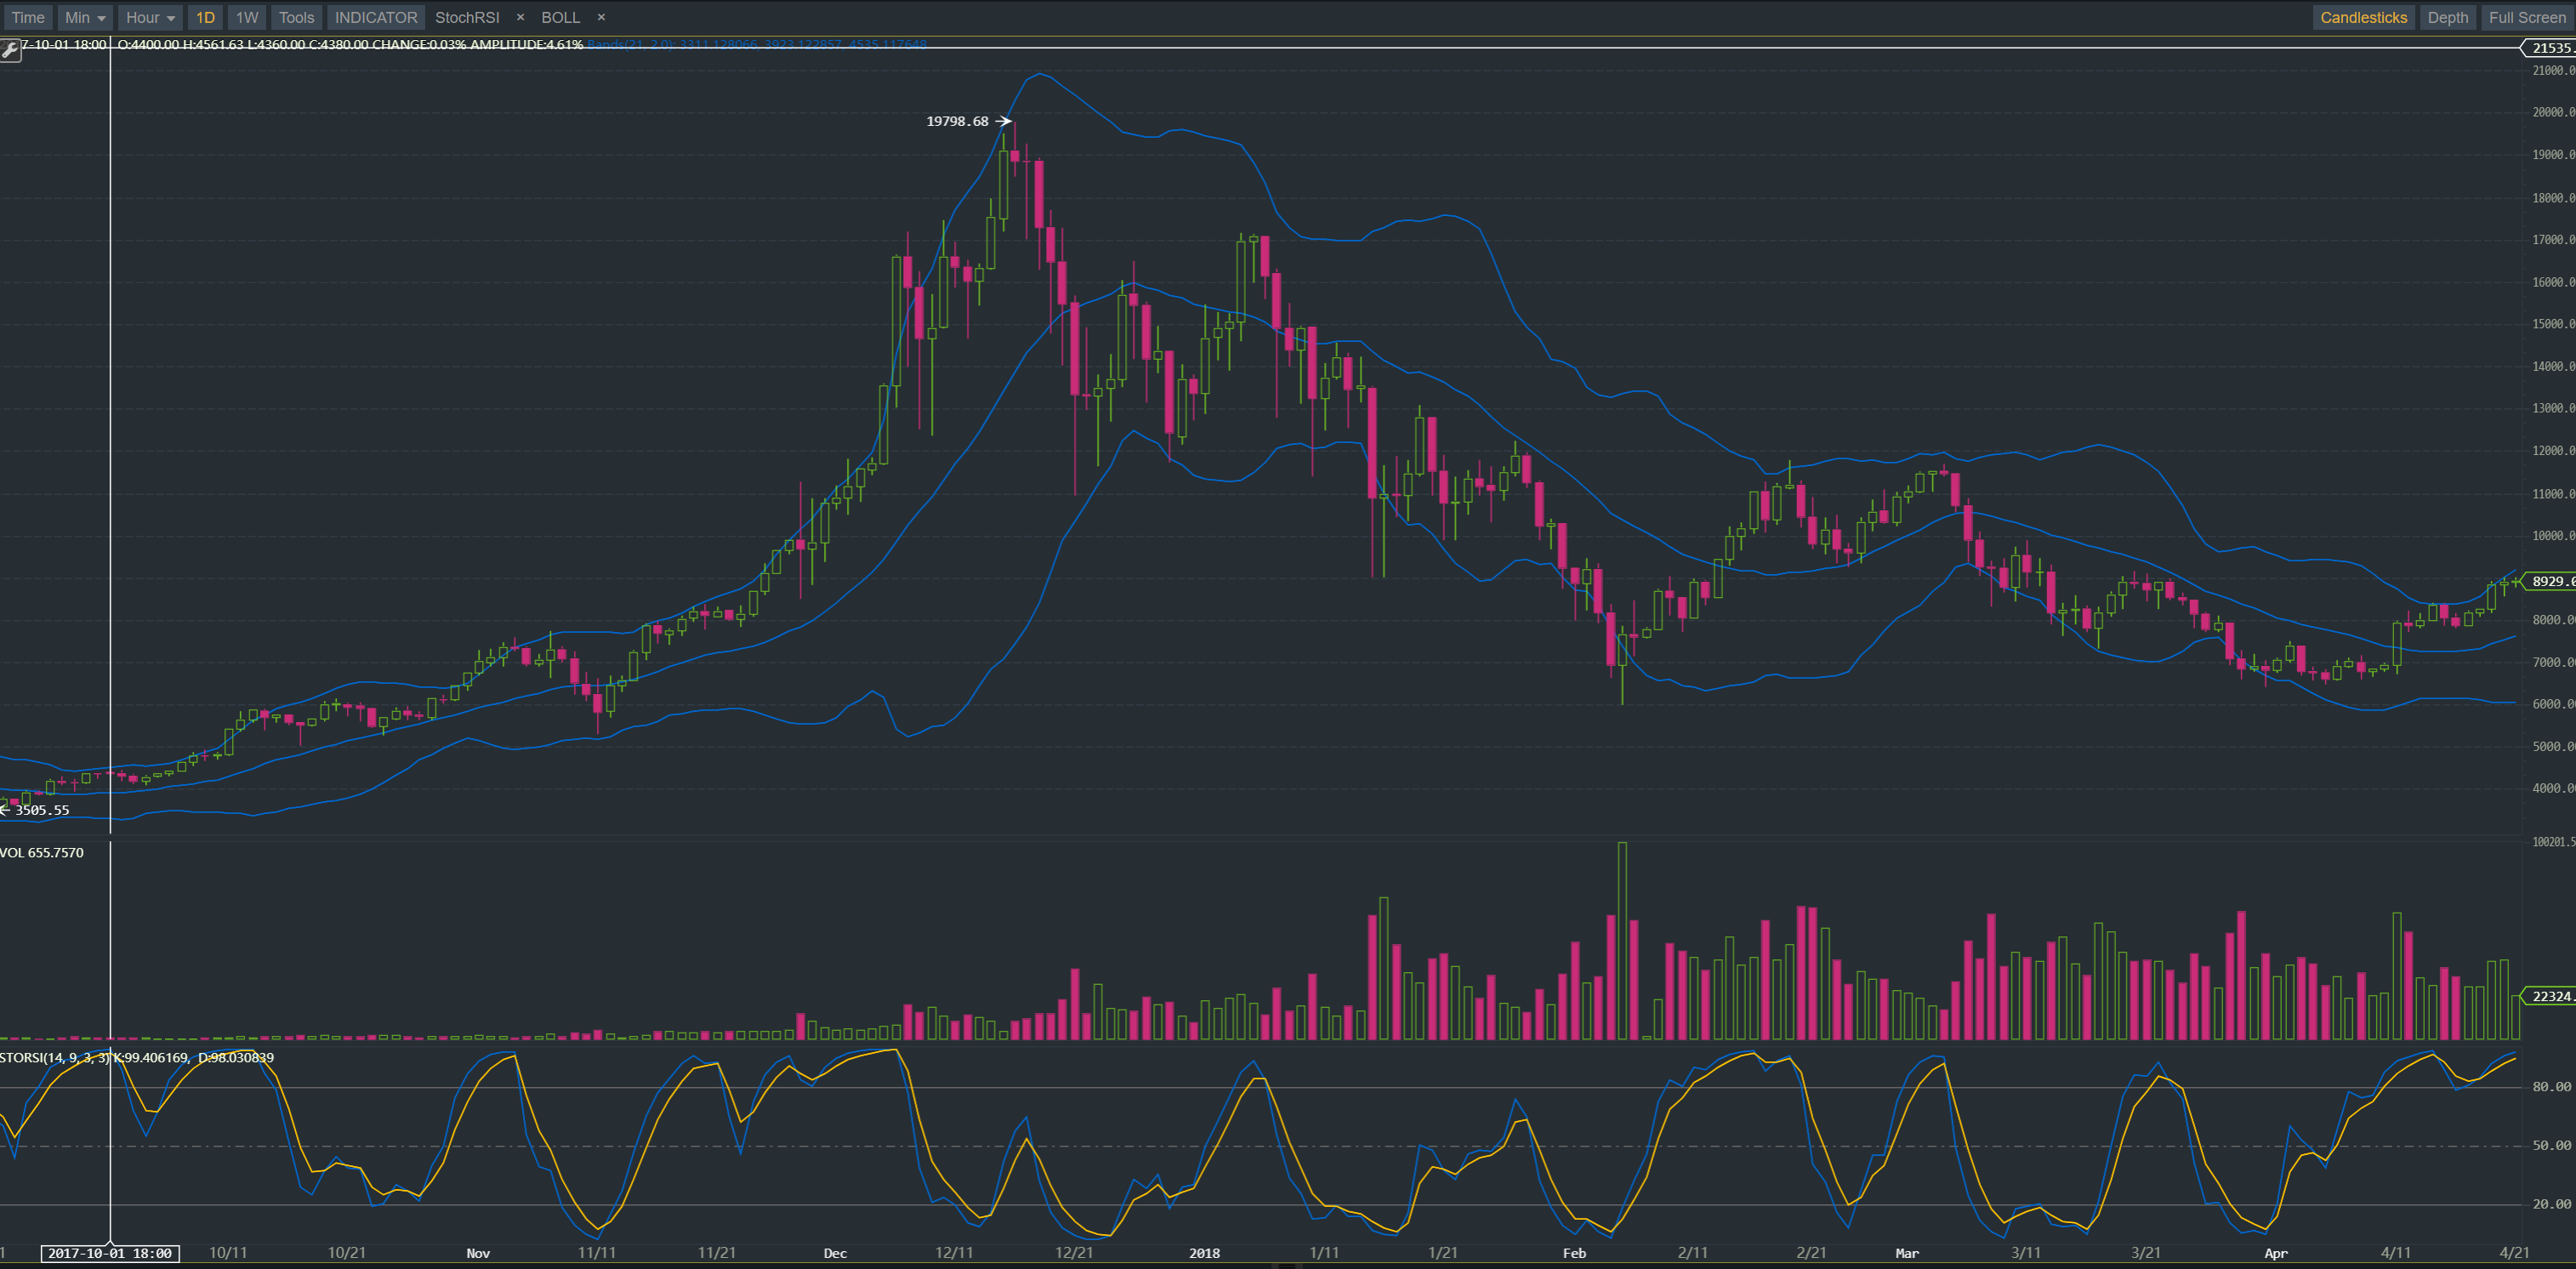 As you can see in the left it went up and down and up and down in the overbought zone. Is that what's going on right now? MACD: Currently it's going up and it looks pretty healthy to me as the two lines have some distance apart from each other. 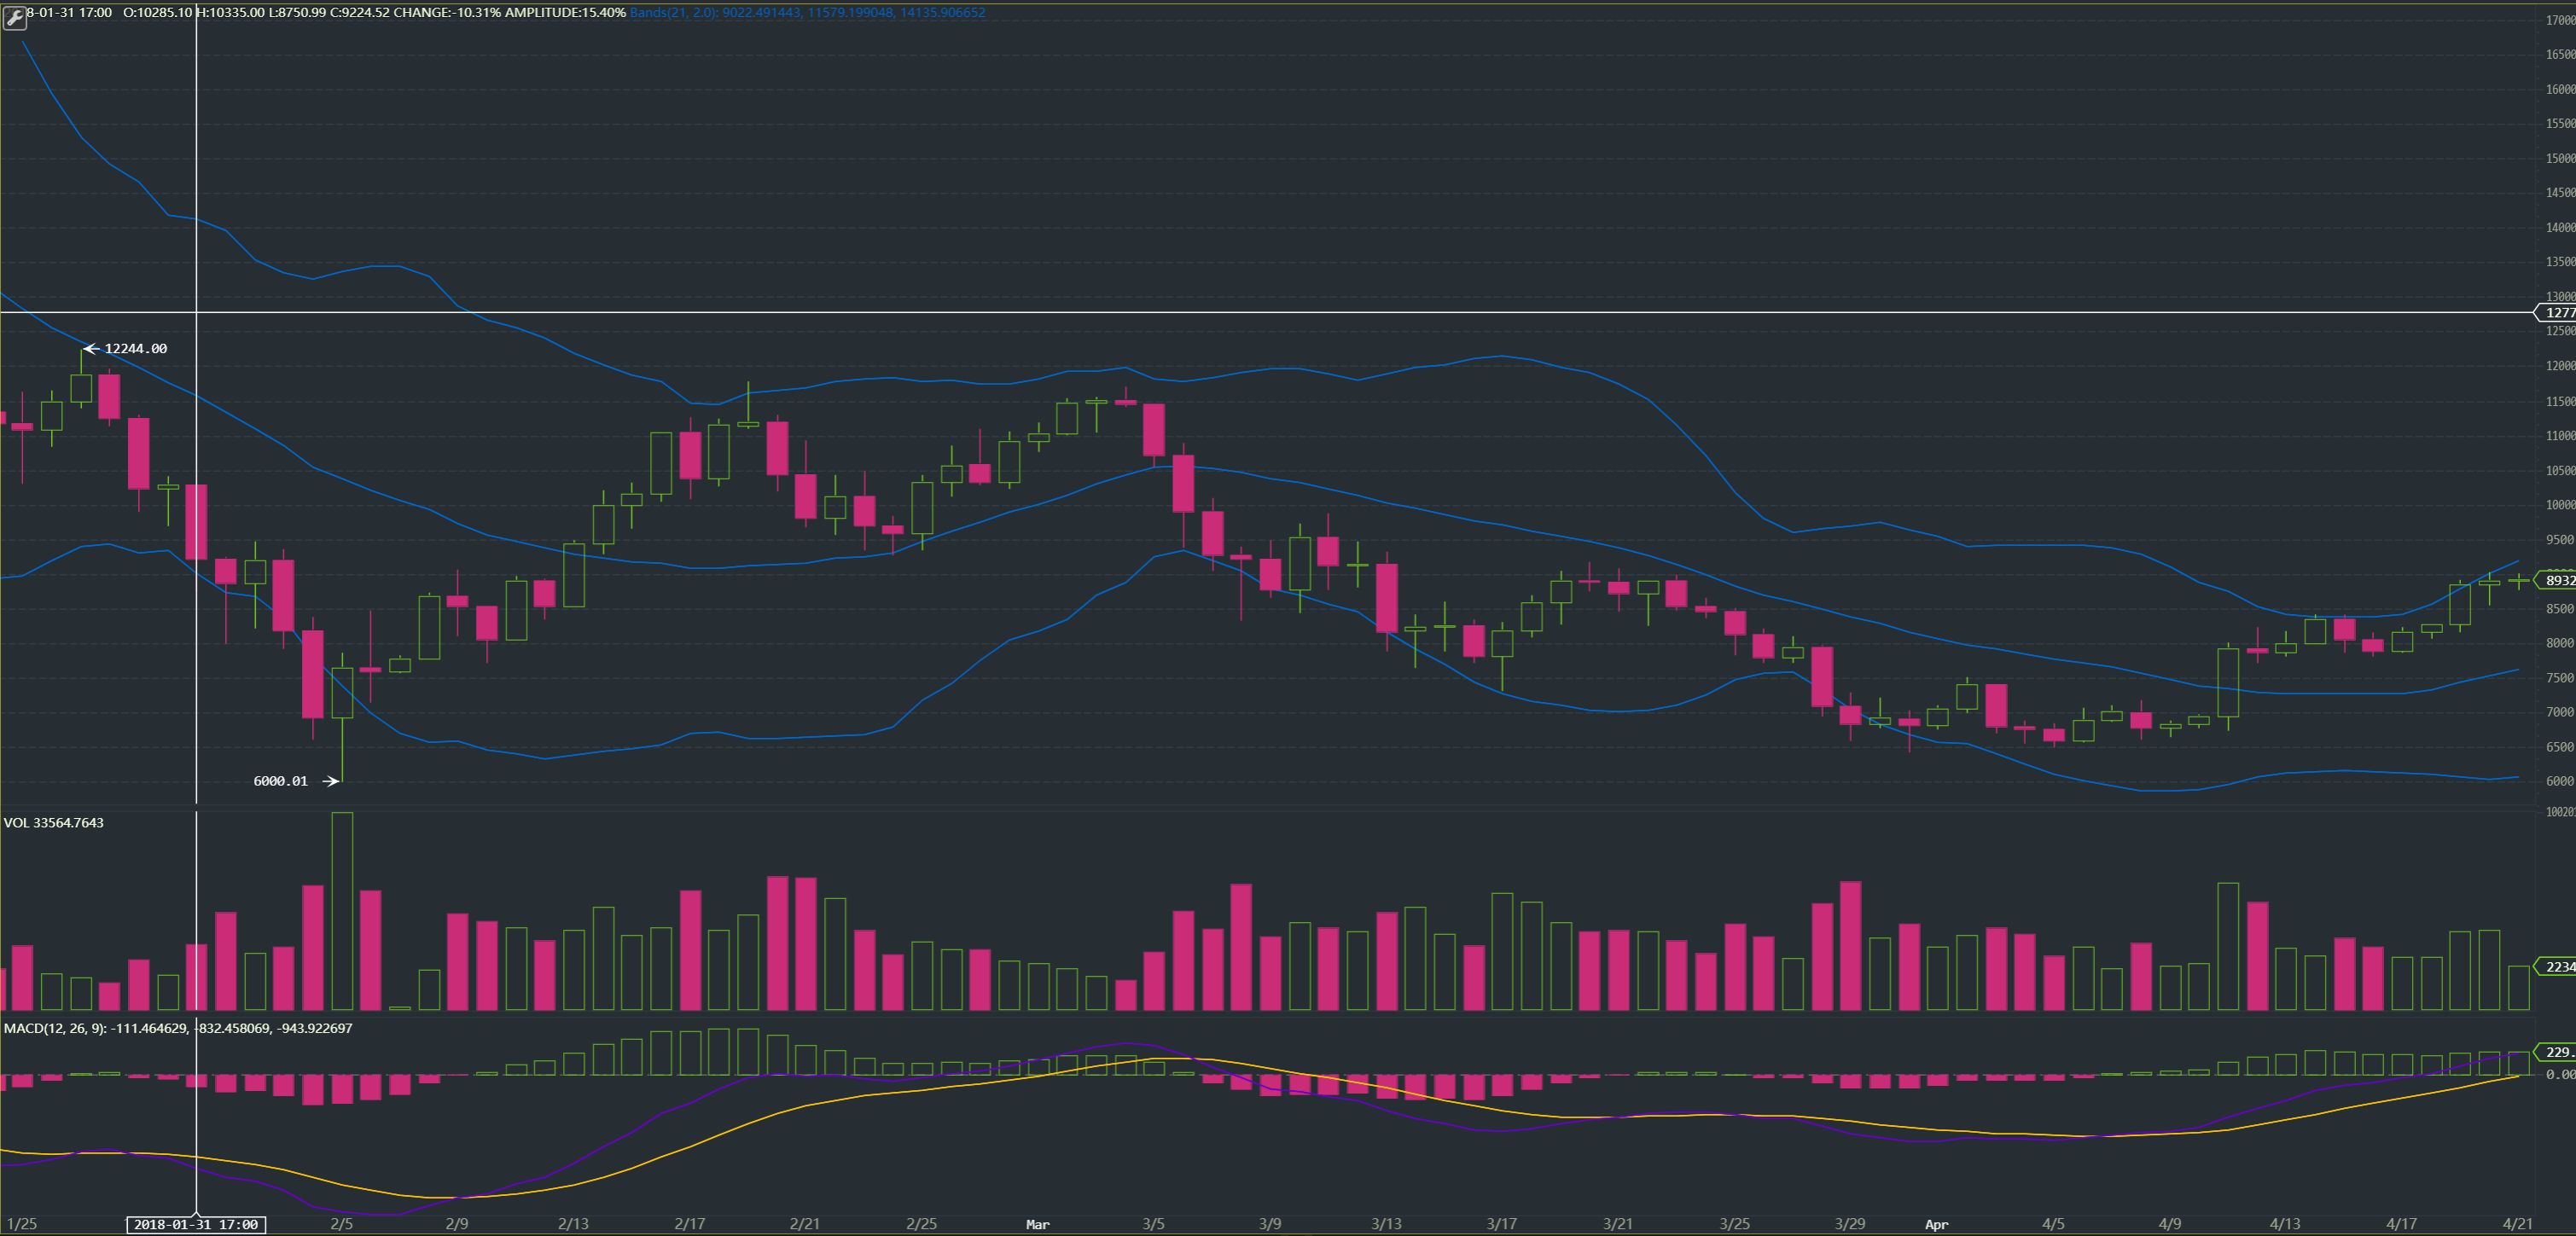 We have officially crossed the primary downtrend line as well.