BTC futures | 8-hour bars | from-the-top | ...(for @ew-and-patterns and friends)
btc·@passion-ground·
0.000 HBDBTC futures | 8-hour bars | from-the-top | ...(for @ew-and-patterns and friends)
In my previous post on the markets, @ew-and-patterns asked me if I thought that BTC would hit the downside channel I illustrated, or if fib-supports would hold the current decline instead. ## <center> The most honest answer to both is that “I don’t know.”</center> <p> I’ve often said in the past that it is the unfolding price-action itself - that dictates the rather dynamic and surprising ways in which the waves will eventually imprint themselves and leave their indelible mark upon history. > >_The closer one gets to interpreting waves in “real-time,” and especially on intraday day charts, the more frequently one typically needs to constantly adjust and re-tune their respective wave counts as the price action unfolds._ > All that said, I hope this quick “intra-day” chart and "nomenclature" guide helps to clarify the shorter-term prospects for various terminals to some meaningful extent. >_Okay, so before we get going, here is another lightning fast 2-minute video-primer on EWT._ > https://youtu.be/d11r7yPWpI0 # <center> How does @passion-ground feel about “Elliott Wave Theory?” </center> <p> > >_After 20-years, I have thus far not been able to see any solid evidence that the theory can be mathematically translated into a programmable trading strategy. Nonetheless, I believe it is one of the best tools from which to frame the past and anticipate the future behavior of market prices._ > >_Given the fractal nature of Elliott’s' repetitive dynamic wave formations, proper application of his principles provides us with a richly textured and unique perspective, as to the historical significance of any developed price series. It conveys to us with high probability, just how such price history is most likely to have meaningful impact, and effect on the present and future course of price action._ > >_In a much broader, and philosophical context, the historical study of Capital Markets via Elliott Wave, is a fascinating way in which to recognize, document, record, and more importantly, "anticipate" - the various degrees, and stages of progression, achievement, challenges, and historic advancement of mankind itself._ > >_The study and discipline of Elliot Wave Theory is unique in that no other method of technical analysis provokes deeper thought, retrospection, or fosters a rebirth of wisdom imparted through lessons of the past. Nor does any other method of technical analysis provide such a dynamic model for developing, monitoring, and formulating high probability forecast assessments of both present and future market conditions._ # <center> @passion-grounds Nomenclature for the 9 Degrees of Trend </center> <p> <center>  </center> # <center> The Decline | 8-hour Bars | from the Top </center> <p> Isn’t it rather interesting that the recent all-time-high in December and subsequent 50% decline since - took place right around the time the CME began trading BTC futures? Hmm… I sure hope the vampire squid bankers don’t get their market-rigging tentacles around BTC like they have with Gold and Silver. Don’t put it past them. The chart below is rendered from my TradeStation platform, which recently began providing BTC price data shortly after the commencement of futures trading on the CME _(Chicago Mercantile Exchange)._ One of my favorite approaches to discerning preferred and alternate wave structures at varying degrees of trend is to use the Occam's Razor method. This means that I search for the preferred and alternate counts that fit the price action most simply, and with the least amount of arm-twisting as it were. <center> 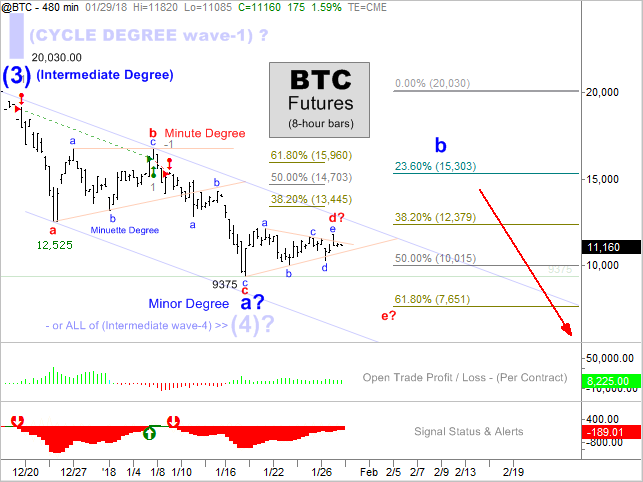 </center> Firstly, to explain the lower chart panels, in brief, I’ve embedded one of my automated trading strategies into this futures chart. The panel on the very bottom of the chart depicts the current signal status _(red = bearish / green = bullish)._ Whenever a trend shift occurs amid these 8-hour bars, I get an email alert to such, and then 8-hours later _( at the very next bar’s open)_ the chart automatically changes its market bias and position from bullish to bearish or from bearish to bullish. This particular trading strategy of mine doesn't use stops, and is always in the market, meaning it's never flat. The panel above that tracks open equity or the real-time profit / loss per contract that the automated trading strategy has taken. So with that brief explanation of the lower chart panels, let’s move on to the actual price action, shall we? I’m going to drop a duplicate chart down below here so you can visually refer to it along with reading the text. > >_BTW, for an expanded view of an image, simply right-click the image, then open it in another tab, and the image will then be rendered in full size._ > Thus far, the move down from the top appears corrective in nature; however, should BTC print a fresh new low for the move prior to rallying back north of the 12,525 level noted, then a clearly bearish and impulsive 5-wave decline will have occurred from the peak. <center>  </center> Such a short-to-medium-term bearish event would bolster that a new marginal low of this sort would mark the minor degree “a” wave down. Thereafter, we would naturally then expect a sharp and sustained rally to the minor “b” wave up as noted. As is stands right now, the recent print low of $9,375 earlier in January may possibly have marked the minor degree “a” wave down in question, or most bullishly, _(all of)_ the intermediated wave (4) as noted - also with a question mark. Basis the nomenclature I provided above, this chart is showing the prospects of an _”alternate”_ Cycle-Degree “**I**” peak at the all-time-high, along with the several noted sub-divisions at Intermediate, Minor, Minute, and Minuette degrees. Prospects for an “e” wave down at minute degree _(orange)_ could take BTC down to its full 61.8% retracement near the $7651 level, which would then place far higher confidence that the larger minor “a” wave is at or nearing its terminal – as well as with any marginal new low beneath $9,375. Bear in mind as mentioned earlier, that should such unfold, a prospective a, b, c, d, e, decline to the noted minor “a” down _(at a fresh marginal new low)_ could easily be counted as a five-wave impulsive decline at the “minute” degree with the very same result and inference. Finally, and along similar lines, if $9,375 holds its print low, and BTC is able to rally north of the $12,525 line-in-the-sand of invalidating a larger bearish impulsive decline, it would add confidence that either the Minor degree “a” had indeed terminated at the $9,375 low, or most bullishly, that the Intermediate Degree (4) wave terminated at that juncture. As such, basis this 8-hour chart anyway, the key levels to watch for various confirmations / invalidations are the $12,525 handle, and the $9,375 handle. >_Well, I hope that answered some of @ew-and-patterns questions, and perhaps sheds a bit more light as to where we might be from an Elliott Wave perspective within the current decline._ > >_Until next time,_ # <center> Peace, Love, and Justice for ALL </center>
👍 steembirds, jacobprice, lloyddavis, meno, avesa, beelzebub, buckydurddle, belial, demogorgon, aamon, zuul, famunger, ew-and-patterns, mmshah, dysprosium, bitcointv, jfernandez, tumtum01, bubke, pinkjasmine, styxdj, cryptophile1, mys, js07od, halicrypto, g10a, alinix, fahmidamti, drifter1, tombort, gaborockstar, cannonball6, bluedog1, humblestudent, heriyanda, razyzieey, hilladigahackles, famg, cogitoergosum1, gabrielinho, malikalvaro, medicinaenvideo, gummedshoes, aluxstem, tobydj, kywt,