MICRO MATHS PLUS-Play with the mathematical functions.
utopian-io·@peerzadaaabid·
0.000 HBDMICRO MATHS PLUS-Play with the mathematical functions.
#### Repository https://github.com/mkulesh/microMathematics 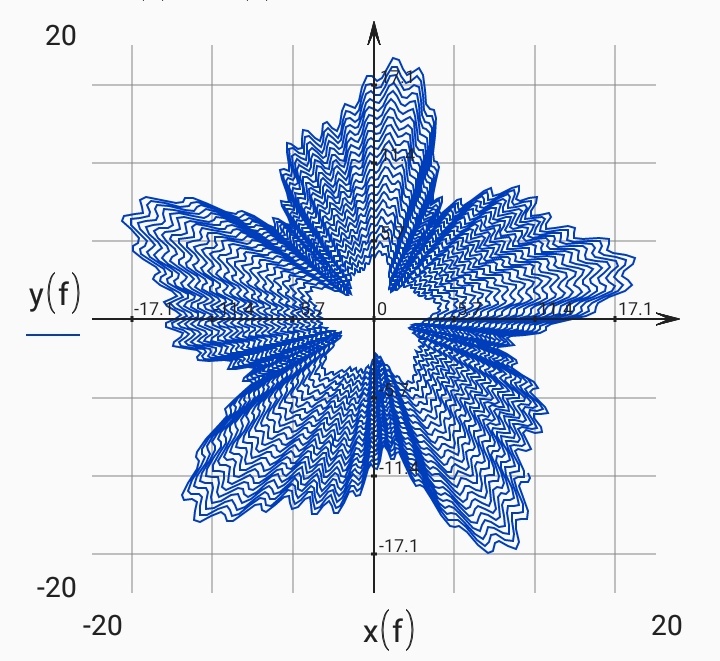 ## Introduction While using the high-level software on windows, I wonder where the world would have been if mankind will get the somewhat , same functions and features on Android OS too. I used to plot the 3D plots on the MATLAB software, later I came to know about the micro maths plus app on Android. Of course, I found the app much interesting as I do not have to open windows OS again and again just to plot these functions. Later I found the results displayed are the same in both operating systems and I thought I should now prefer micro maths+. Here in this blog, I am going to mention some of the main features, about micro maths plus which is the open source app. In this post, I will also pen down my experience and the suggestions which I got while using this open source app. This blog will include the following major core functions and features of this app. ###### ● Function Plots ###### ● Polar function plots ###### ●3 D plots ## Post Body It has been a long time using this app and I found this app quite interesting. Moreover, Its many inbuilt functions like ~pi~ make me fall in love with this app. I will describe all the above-mentioned functions in detail one by one. So let us get started. #### ● Function Plots Describing a function, and later plotting its graph is not an easy task in case of complex functions. **Defining the function** First of all, you have to open the new worksheet and start typing a valid function which must be dependent on each other. You can choose 2 to 3 or much more functions. Later you have to define its arguments in the worksheet, I mean its limits of functions. Later on, after clicking on the ok button the graph of the function will be displayed in front of you. You know you can even save the graph in the pdf format, and even you can later edit it too. 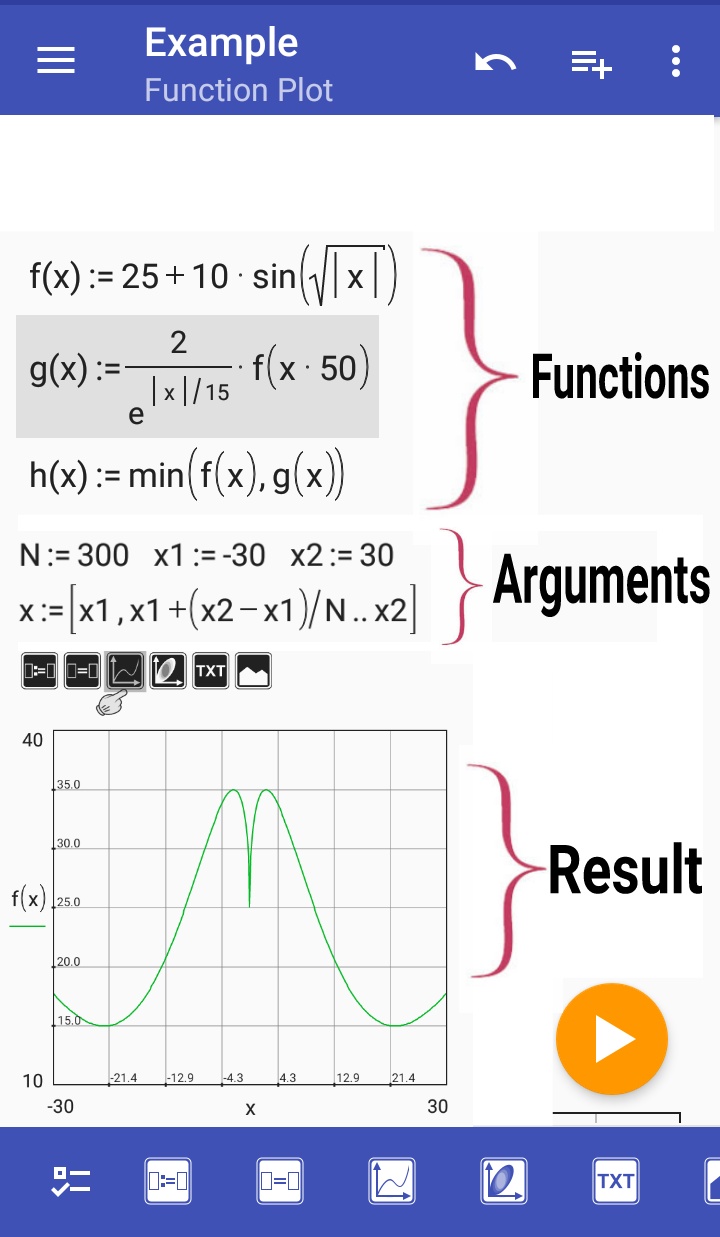 #### ● Polar function plots. Hope you may be knowing about three coordinates systems(cylindrical, spherical and Cartesian), and one of them is the polar coordinate system(combination of cylindrical and spherical systems), and plotting the function by physical means is the onerous process even for the simple function, but I think getting the glimpse of this app will make it too easy. **How to describe the function** Similarly, as you define a function above and later define its limits. It will surely display the results provided the functions defined are defined in a proper manner. Here is the example of how you can make the Japanese maple. 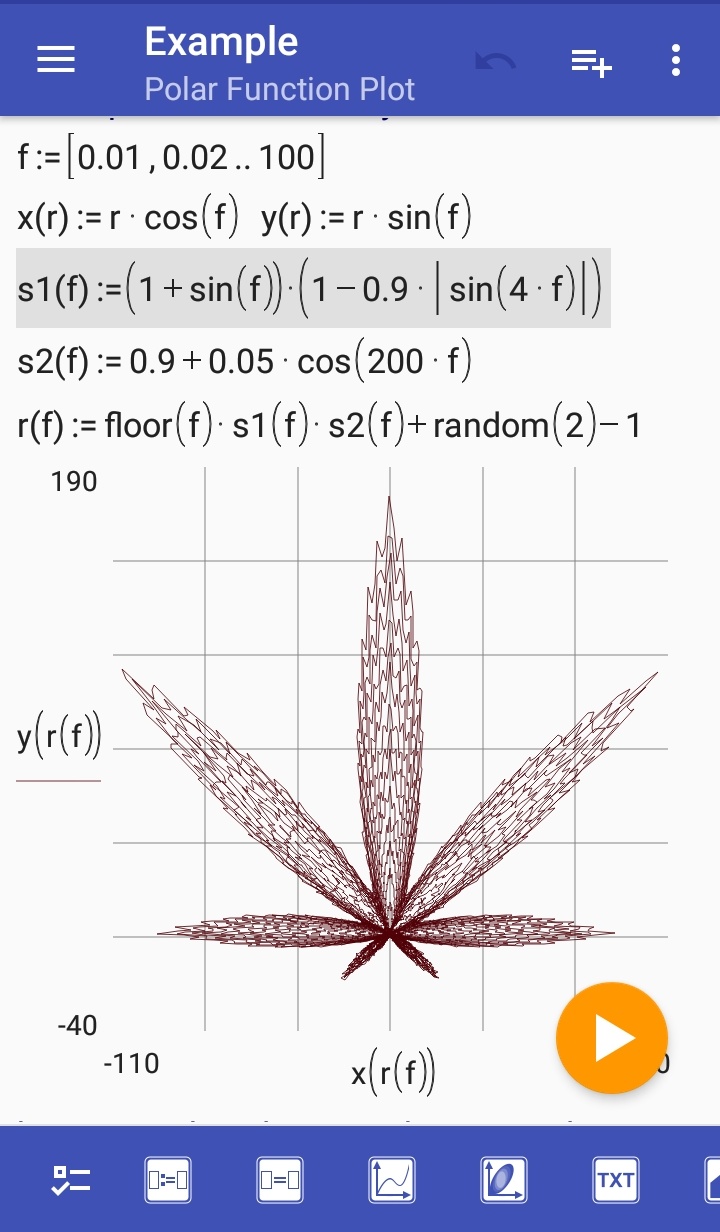 #### ● 3D plots I hope you will not get confused with the function plots and 3D plots. The function plots are line diagrams but the 3D graphs are the surface diagrams in space. The following example demonstrates 3D plots for three different functions including two variable. First, you have to define intervals for both x and y arguments. Later you can define a particular function, to get the required answer 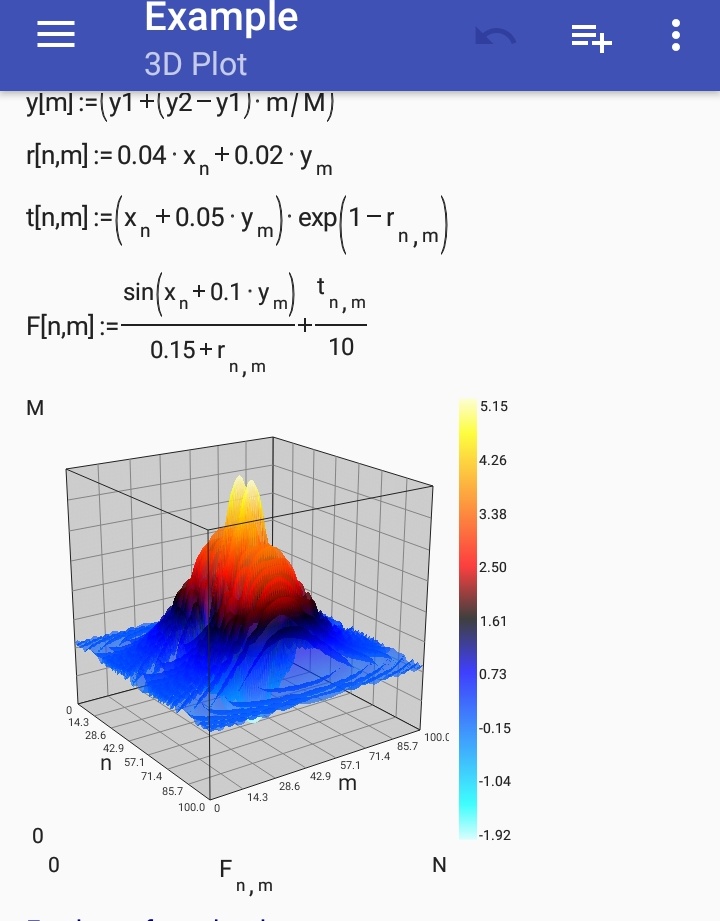 ## Resources The images used in the blog are the screenshots, taken from the app. ## Series Backlinks This is my first contribution to the blog category of utopian.io
👍 zugs, minminlou, taigacabinet, jerkybuzzing, womancarve, nikolastelma, anharchenko1987, akravzov1982, atihonov1990, hdikkerson, edvardprays, roman.senchukov, freef, veddol, rimeldal, ererou, tedised, sofoupio, roplo, ofomopi, risted, itousedes, ongath, sompextu, nonga, emotlatal, reayiti, erisederi, uretinged, abeack, erofosto, soughul, urerenene, yitit, nispou, orintera, ucrad, ucelorsal, ented, roryootu, endedisha, aceshou, ummutcupi, ulockblock, leir, espoem, mops2e, ascorphat, steemchoose, hungryanu, leduc1984, loshcat, yehey, peerzadaaabid, pinoy, properfraction, hungryharish, lostmine27, amosbastian, rufans, helo, jaff8, asaj, tobias-g, fego, adamada, bestofph, kendallron, pinas, codingdefined, mcfarhat, indayclara, mightypanda, primeradue, steem-ua, sargoon, bejust, feronio, progressing, utopian-io, tombstone, cryptouno, swapsteem, kaczynski,