BITCOIN BTCUSD UPDATE -- price is bouncing as expected.
bitcoin·@phisight·
0.000 HBDBITCOIN BTCUSD UPDATE -- price is bouncing as expected.
May 29, 2018 -- HI Everyone, -- I am pleased to share with you my Elliot wave perspective on Bitcoin BTCUSD price from now onwards. -- Here is today's (May 29, 2018) 6 hour chart on BTCUSD: -- 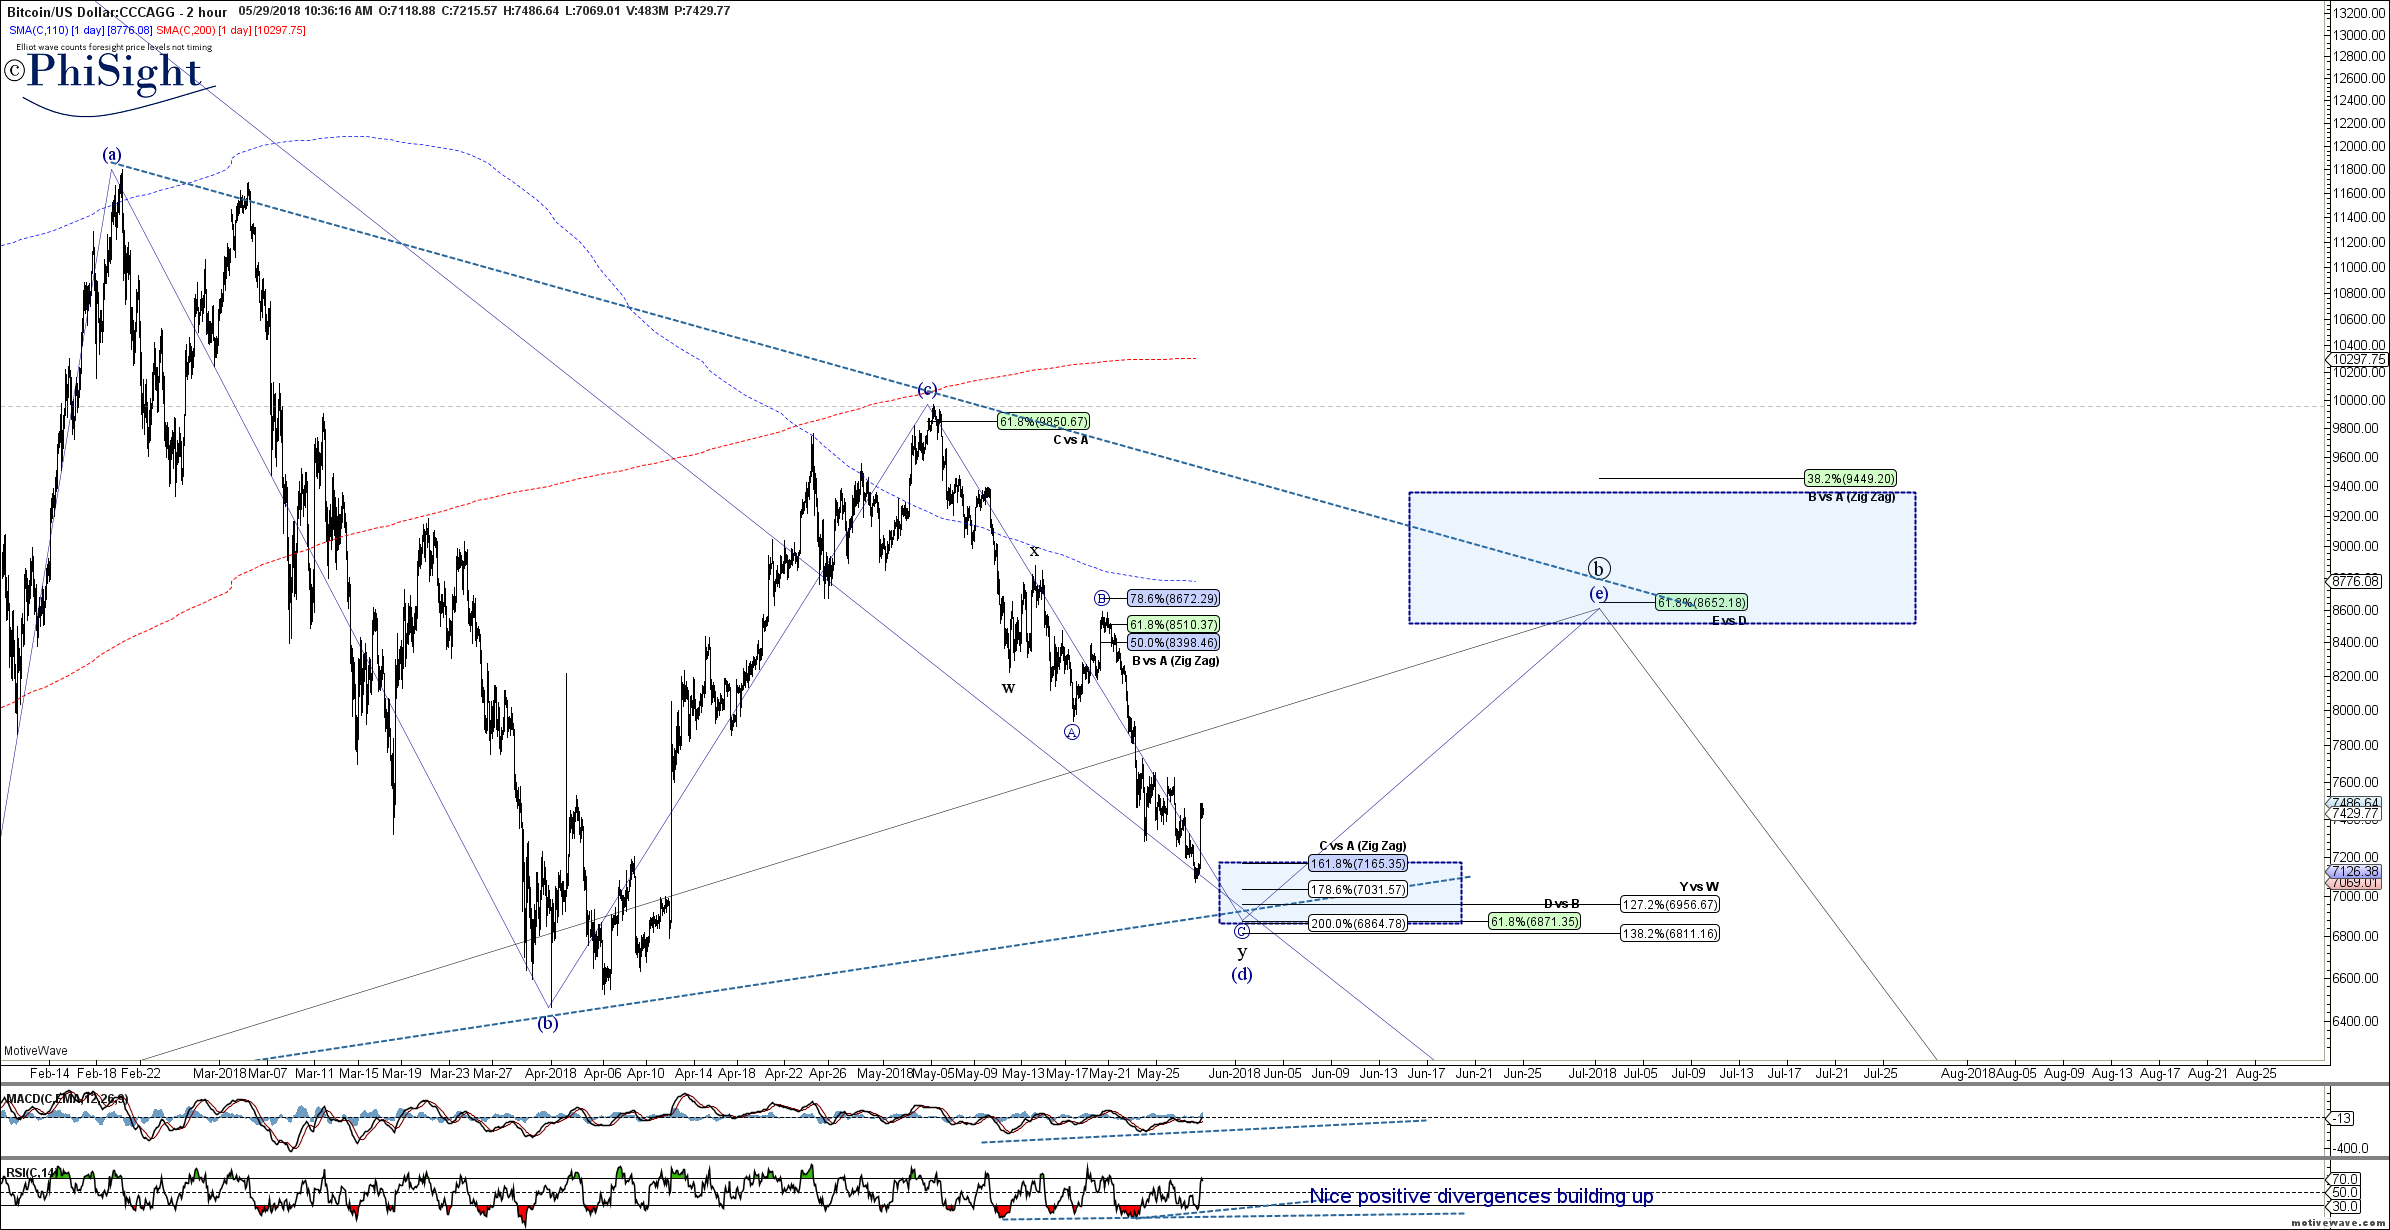.png) This price pattern indicates that the bounce will likely target the 8600 dollar region, around which one has to be careful if long. This is because this could potentially be a B-wave top, with a shakeout in a C-wave down to 3000 dollar region to come. If the price blows through 9850 then something else is playing out and the pattern will have to be reanalyzed. But so far as it stays below the box shown, there is need to be vigilant. A shakeout lower would be an amazing amazing buying opportunity! ---- Yesterday, I published this chart that indicated a bounce is coming and a bounce we seem to have got. --- https://steemit.com/bitcoin/@phisight/bitcoin-update-from-elliot-wave-perspective 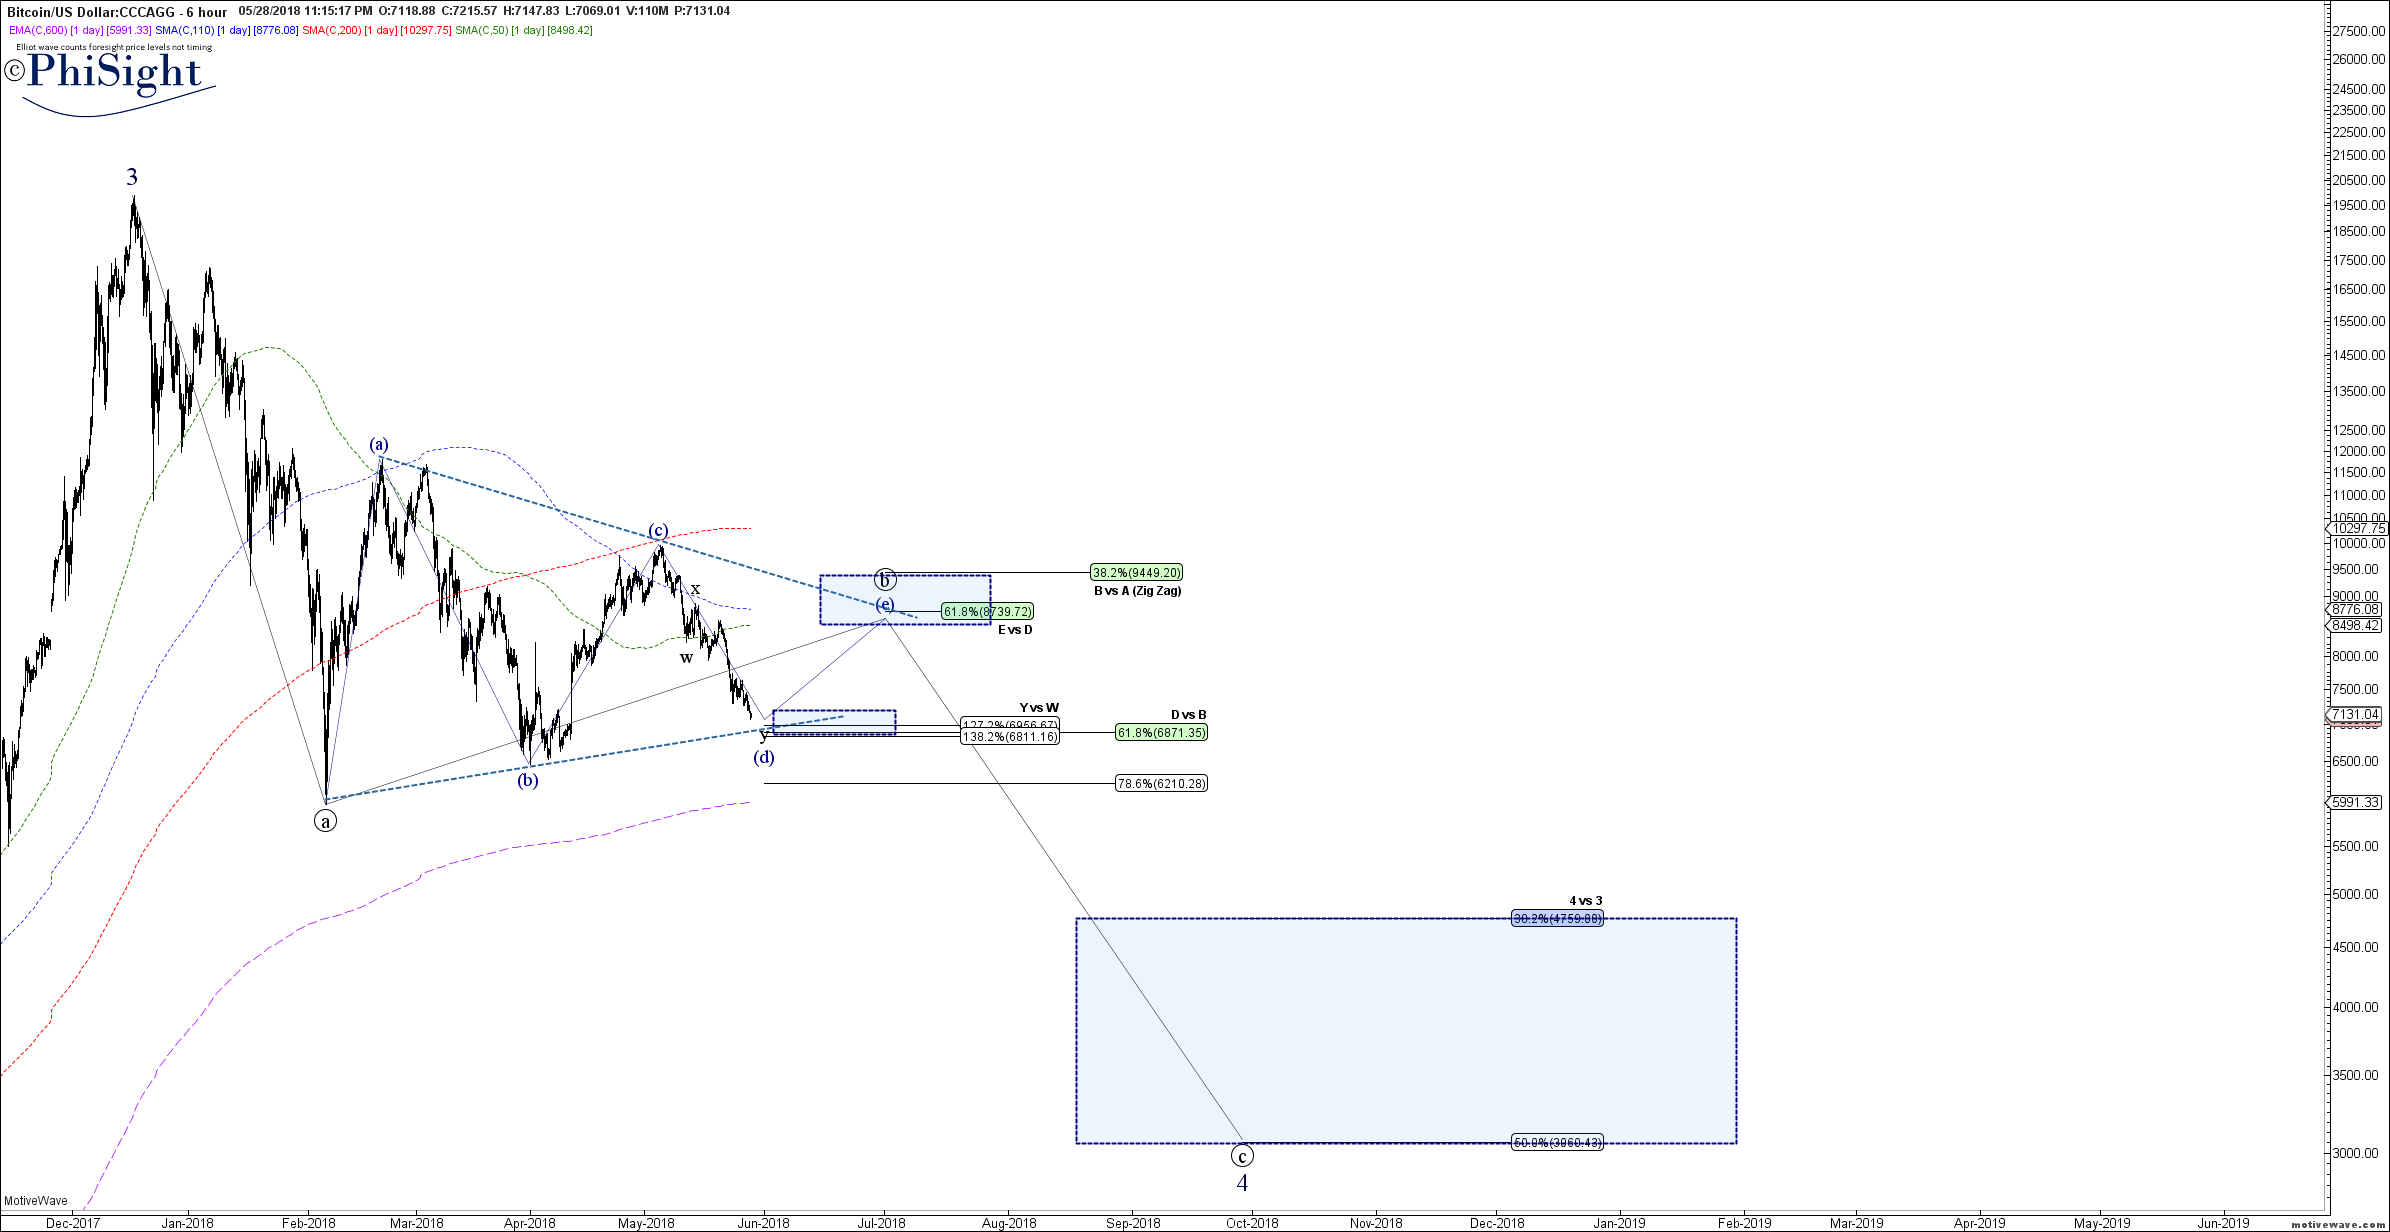.png) and here is yesterday's (May 28, 2018) Daily chart on BTCUSD: --- 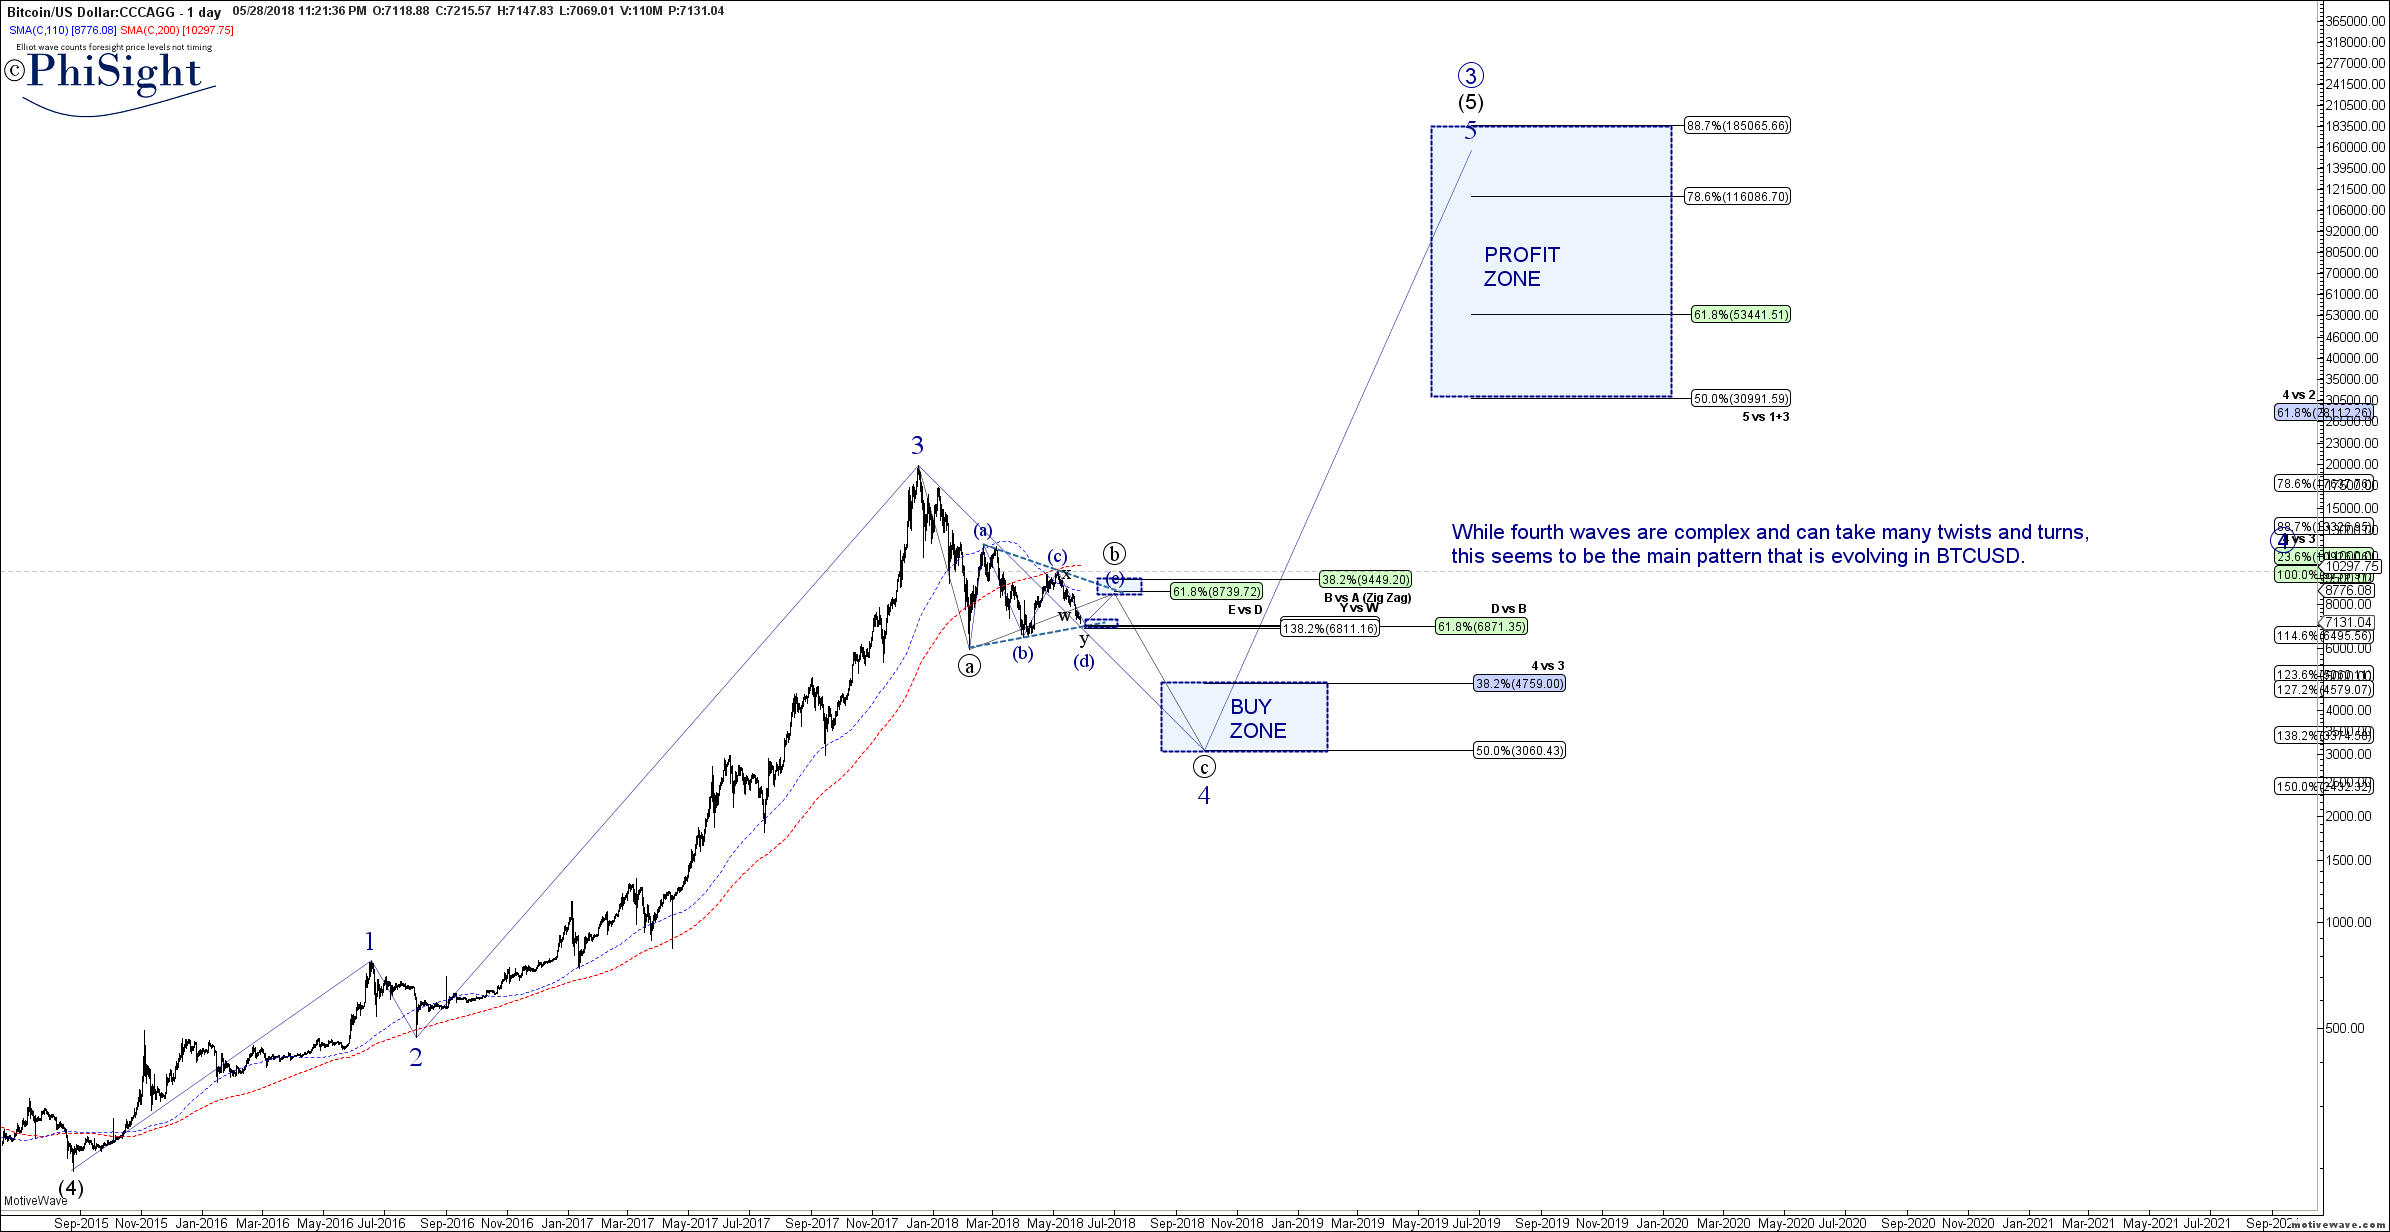.png) Here are my past blogs on this topic. May 15, 2018: https://steemit.com/bitcoin/@phisight/bitcoin-update-using-elliot-wave-counts-btcusd-btc-usd --- 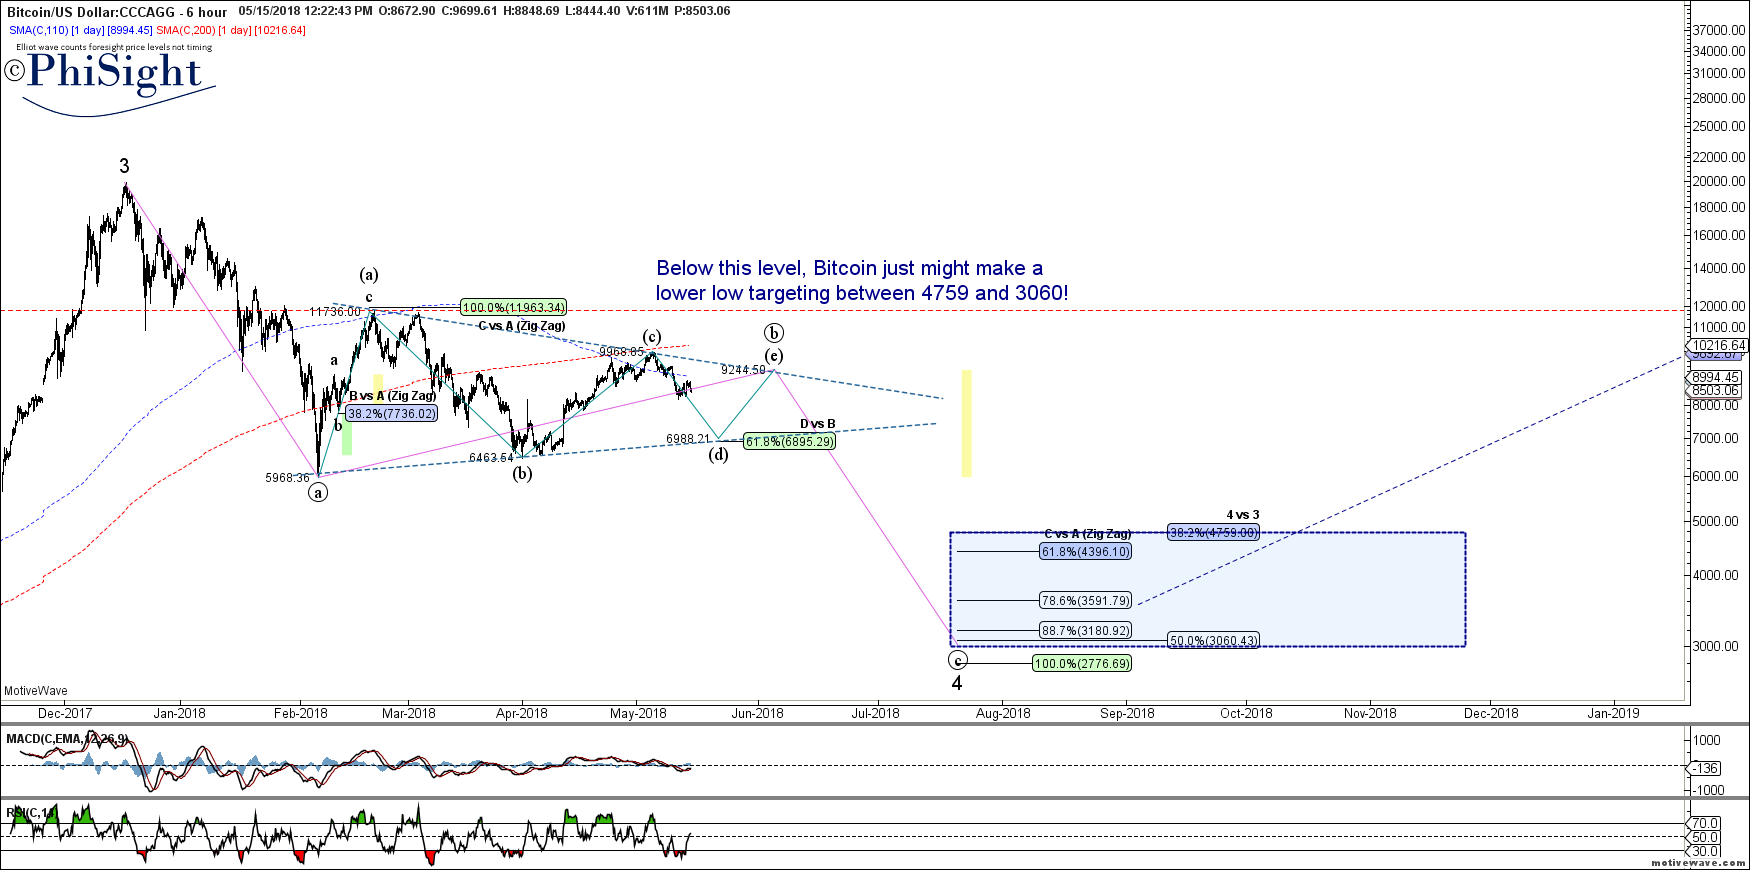_Posted.png) May 12, 2018 https://steemit.com/photography/@phisight/bitcoin-chart-pattern-rhymes-with-ongoing-fractal-in-eos --- 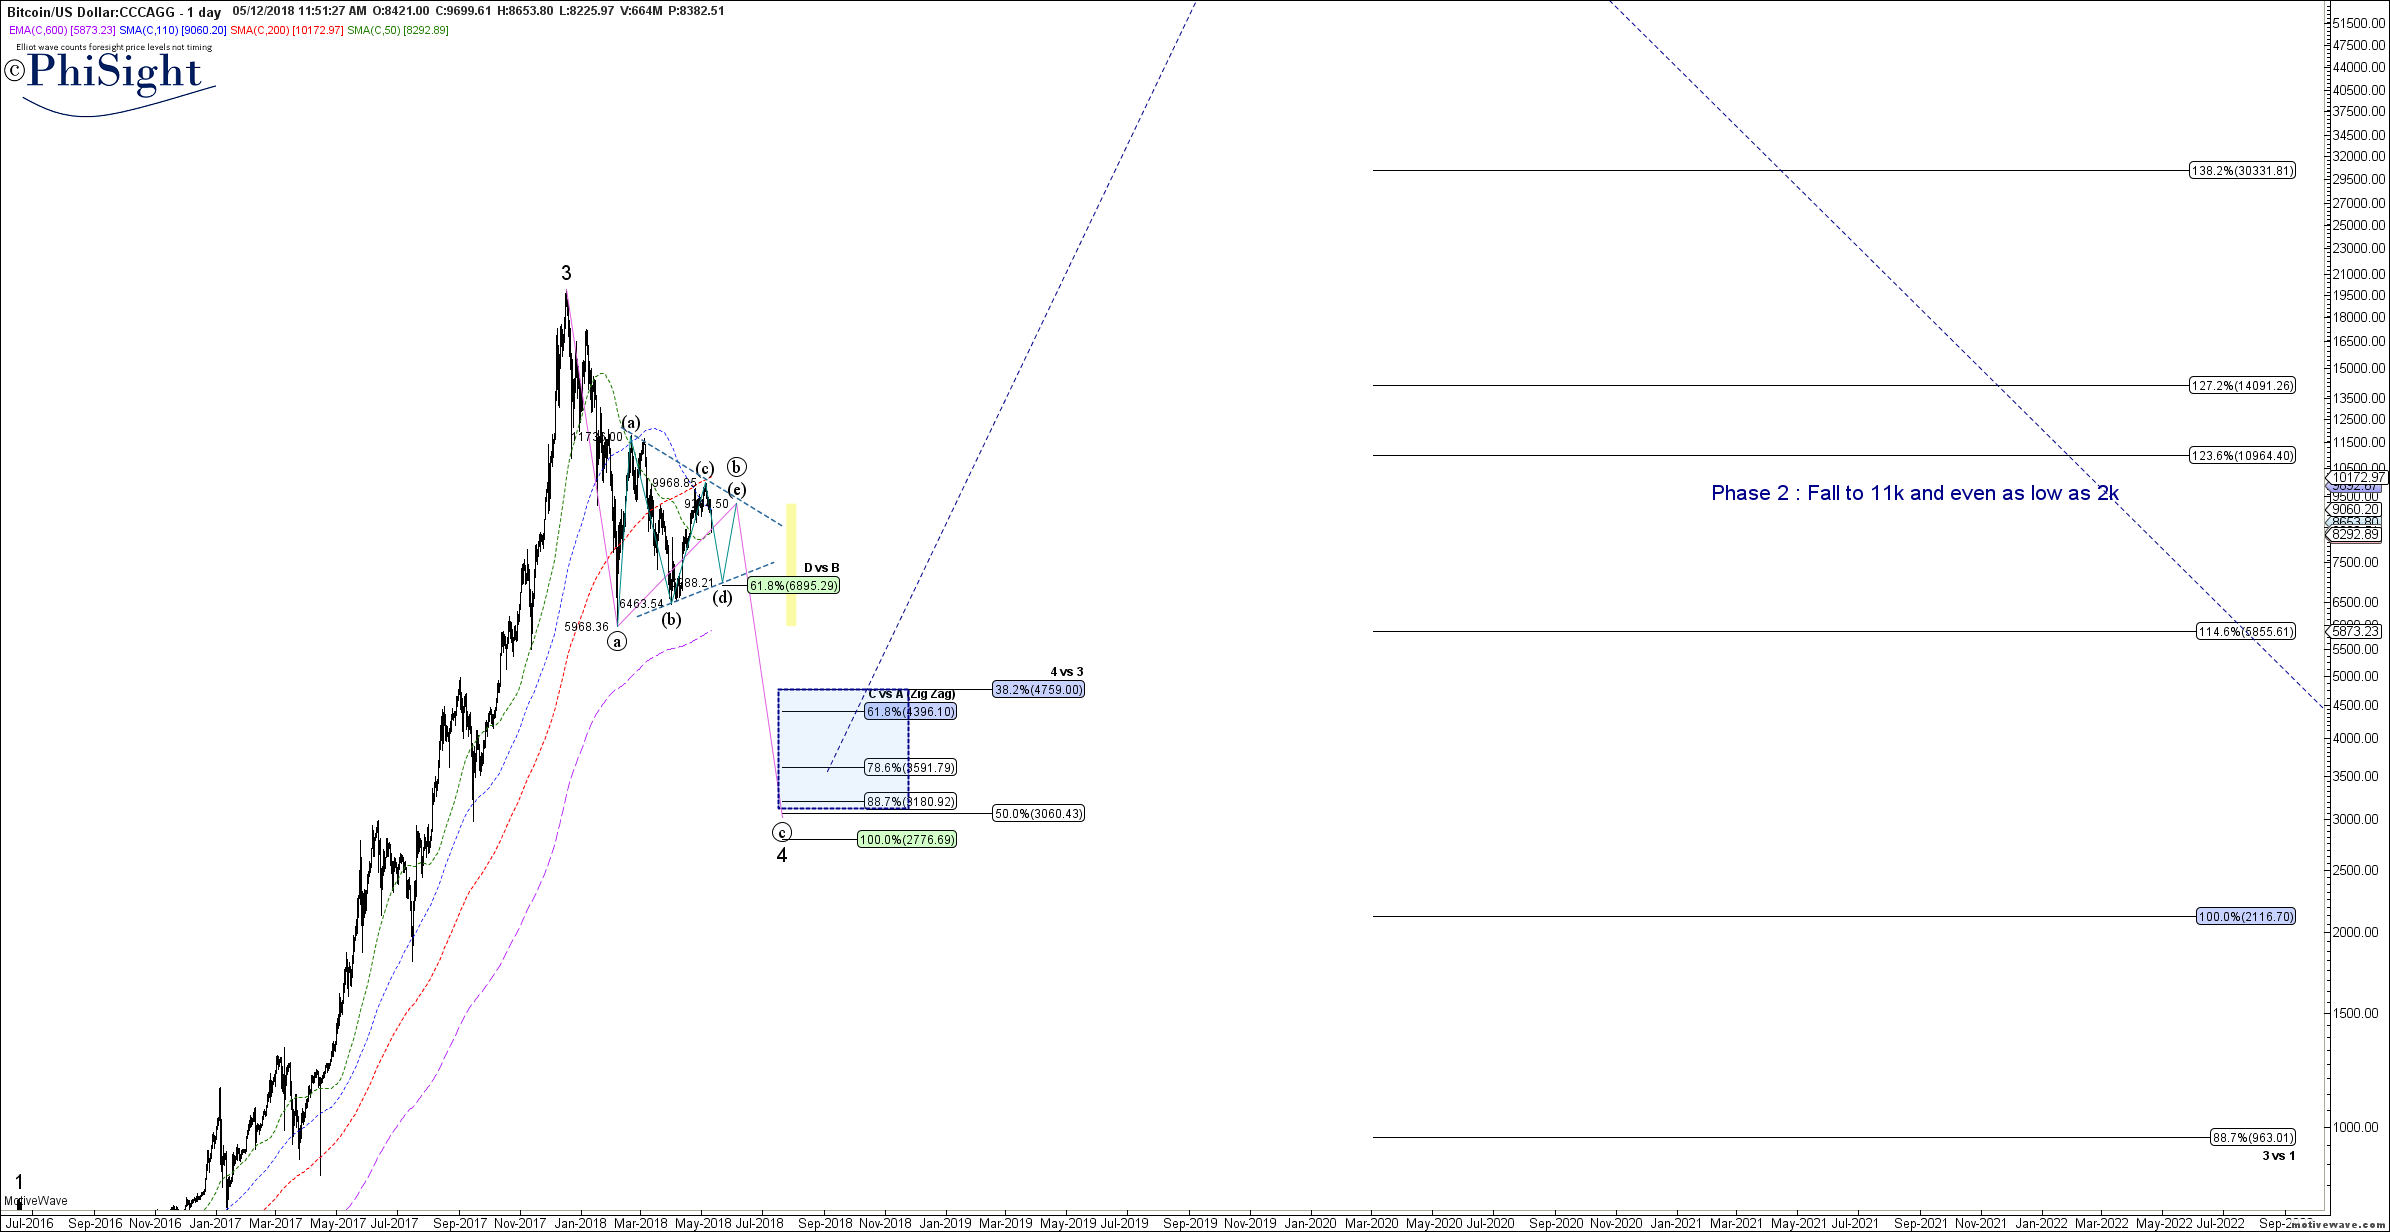%20_Posted.png) I also provided an example of the ongoing fractal in EOSUSD that has a similar pattern: -- 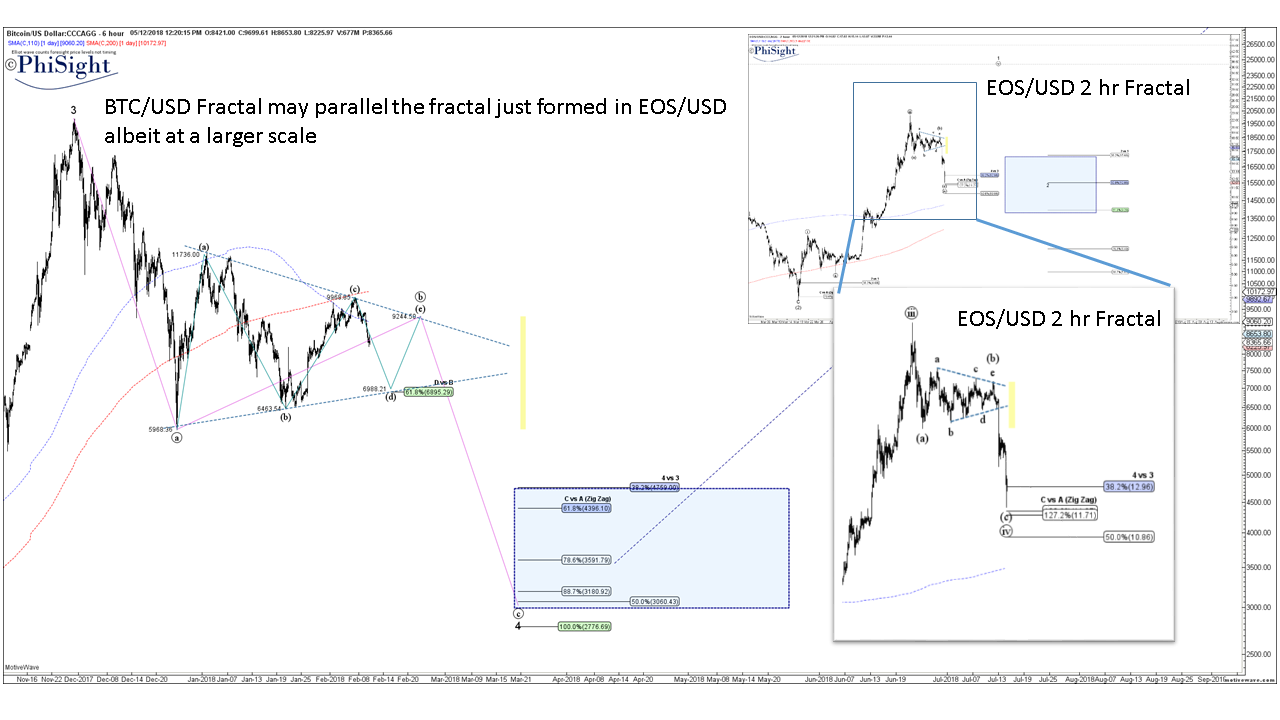 I am hoping to provide Elliot wave analyis on STEEM for all cryptocurrencies if I get your support. I hope you liked this post, and if you did, please upvote me, and resteem my post to your followers. -- Hope this analysis was/is/will be helpful! Note: you can right-click and open charts in new tab to see them at full size -- they are quite large and clearer when expanded. ---