HIVE Blockchain Technologies - Stock Chart Analysis with Elliot Waves
cryptocurrency·@phisight·
0.000 HBDHIVE Blockchain Technologies - Stock Chart Analysis with Elliot Waves
HIVE.V HVBTF Blockchain Technologies https://www.hiveblockchain.com/ ---------------------- May 11, 2018 Corporate Presentation at https://www.hiveblockchain.com/downloads/HIVE-Corporate_Presentation-2018-03-07.pdf HIVE is a cryptocurrency mining company. It runs mining servers in Iceland, where climate is cold (so lower cooling costs for power hungry servers), electricity is cheap (lower power bill), and internet connectivity is excellent (fast transactions and connections to the distributed network nodes and remote monitoring of mining). The corporate presentation (link above) gives the following chart of their coin ownership. 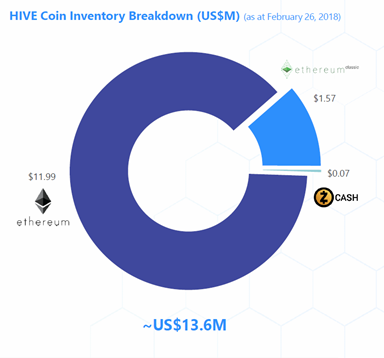 As of Feb 26, 2018, ETH/USD was approximately 900 dollars, hence that's roughly 13333 ethereum coins. My ETH/USD charts, which I will post in a separate blog post, indicate that these will go from the current price to well over 16k, potentially even over 50k. Hence these coins could become worth a sizeable amount and more with continued growth in mining these coins and/or higher ethereum prices. HIVE stock is traded on several exchanges and are a way to participate in the cryptocurrency revolution indirectly through a stock rather than purchasing cryptocurrencies themselves and holding them in a wallet somewhere. The expected increases in ethereum, if they play out, could make the stock take off to orbit! 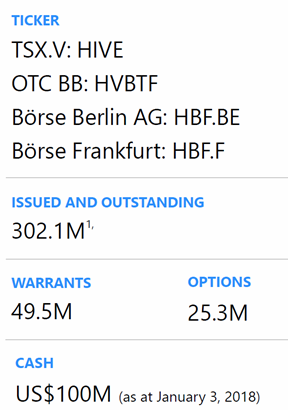 Daily Chart: 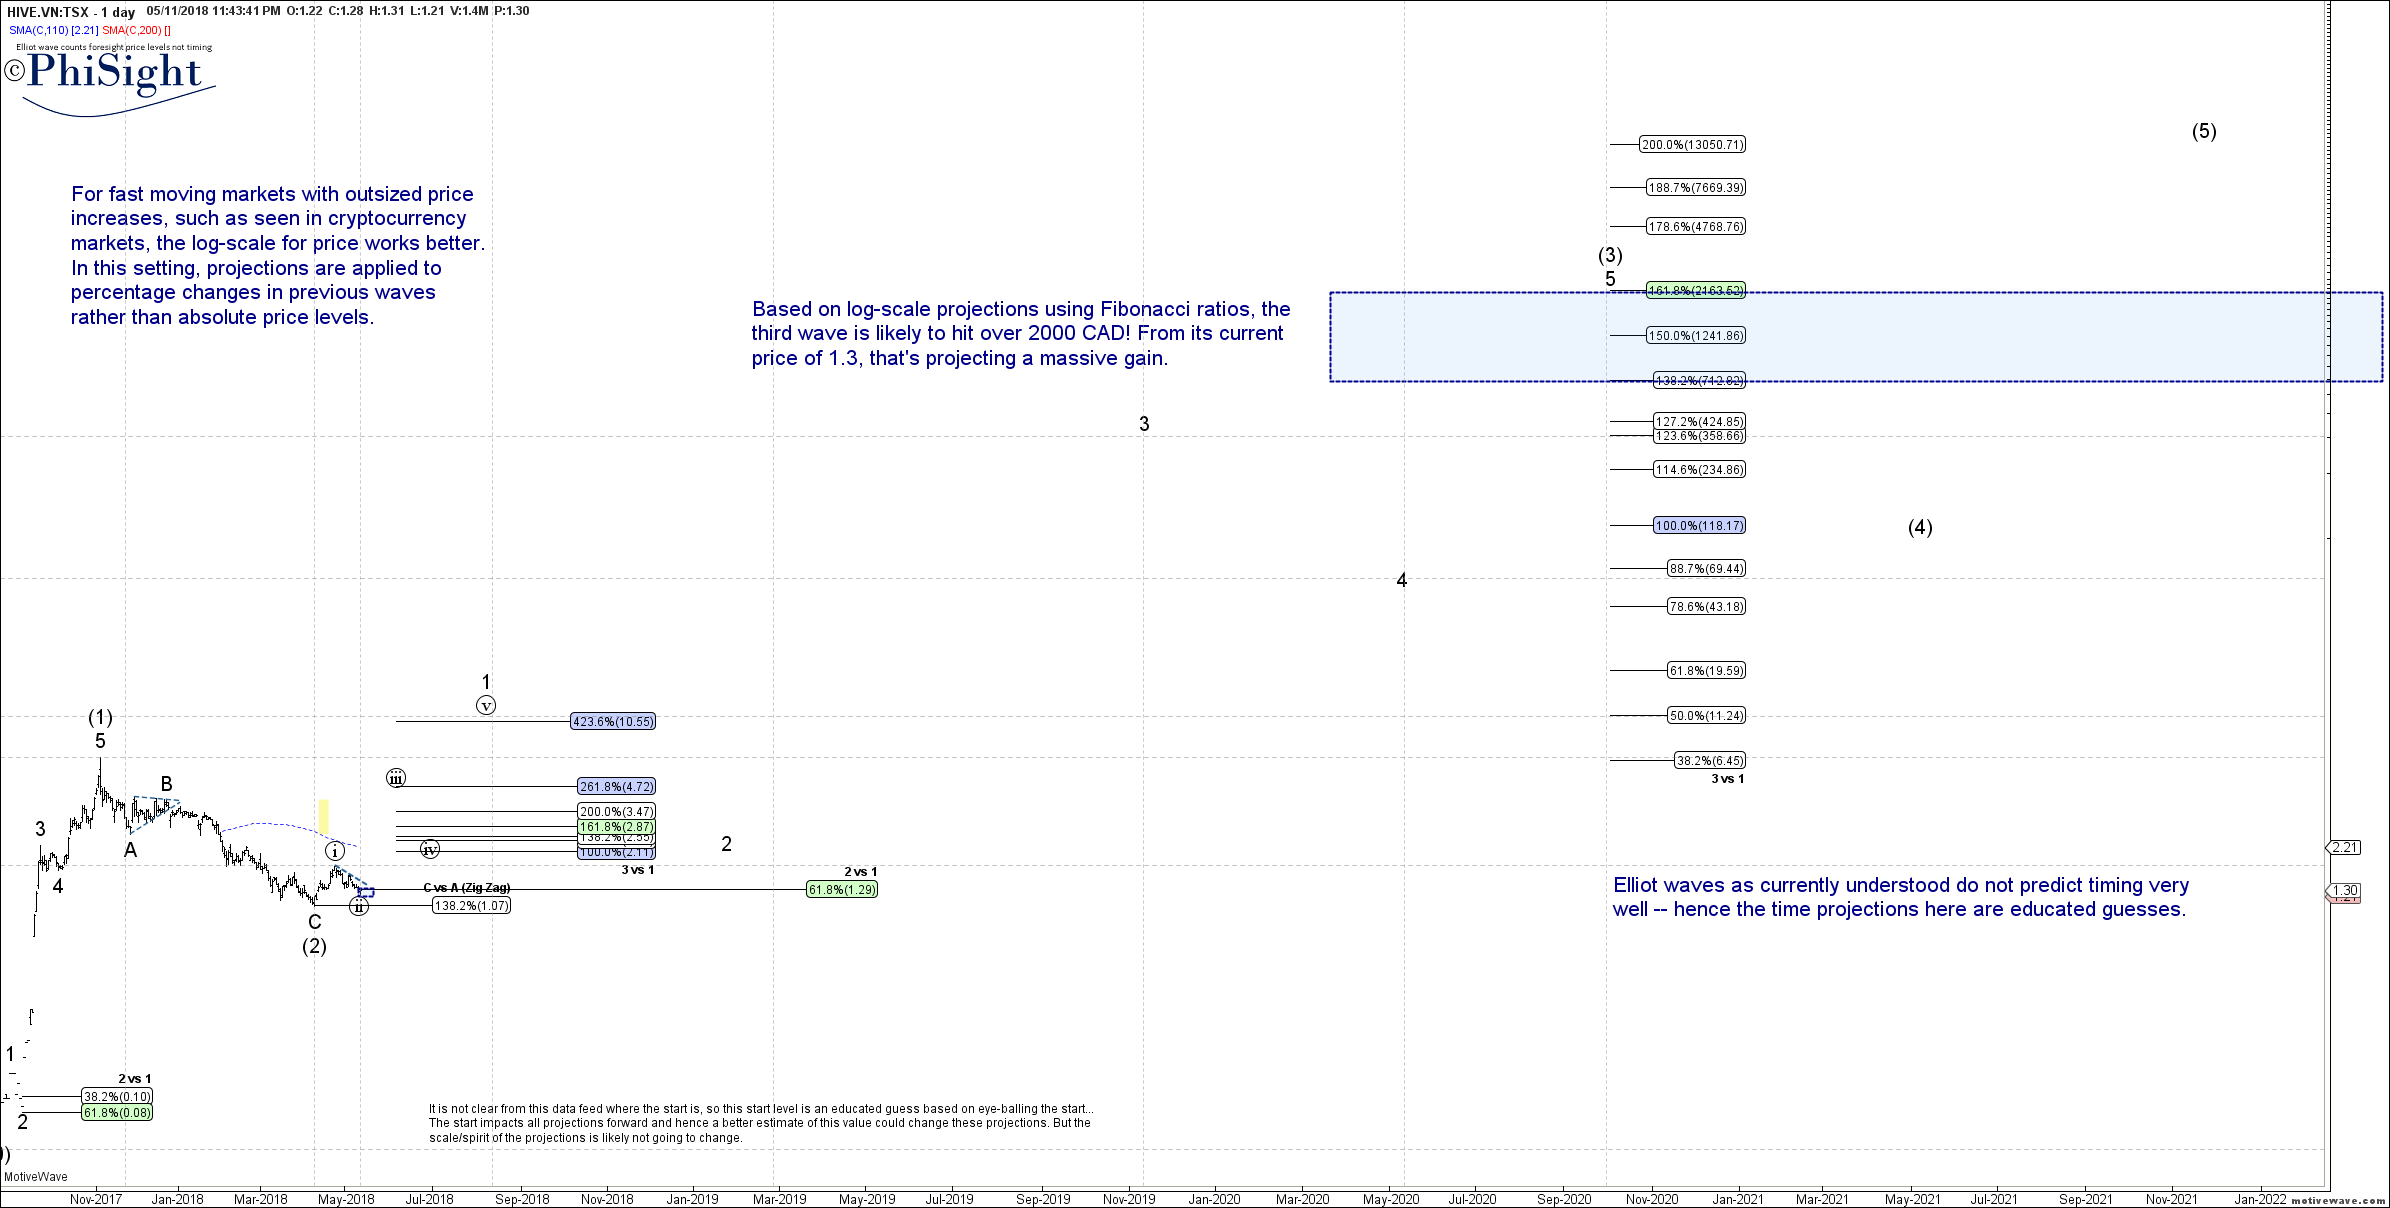.png) 2) Hourly Chart 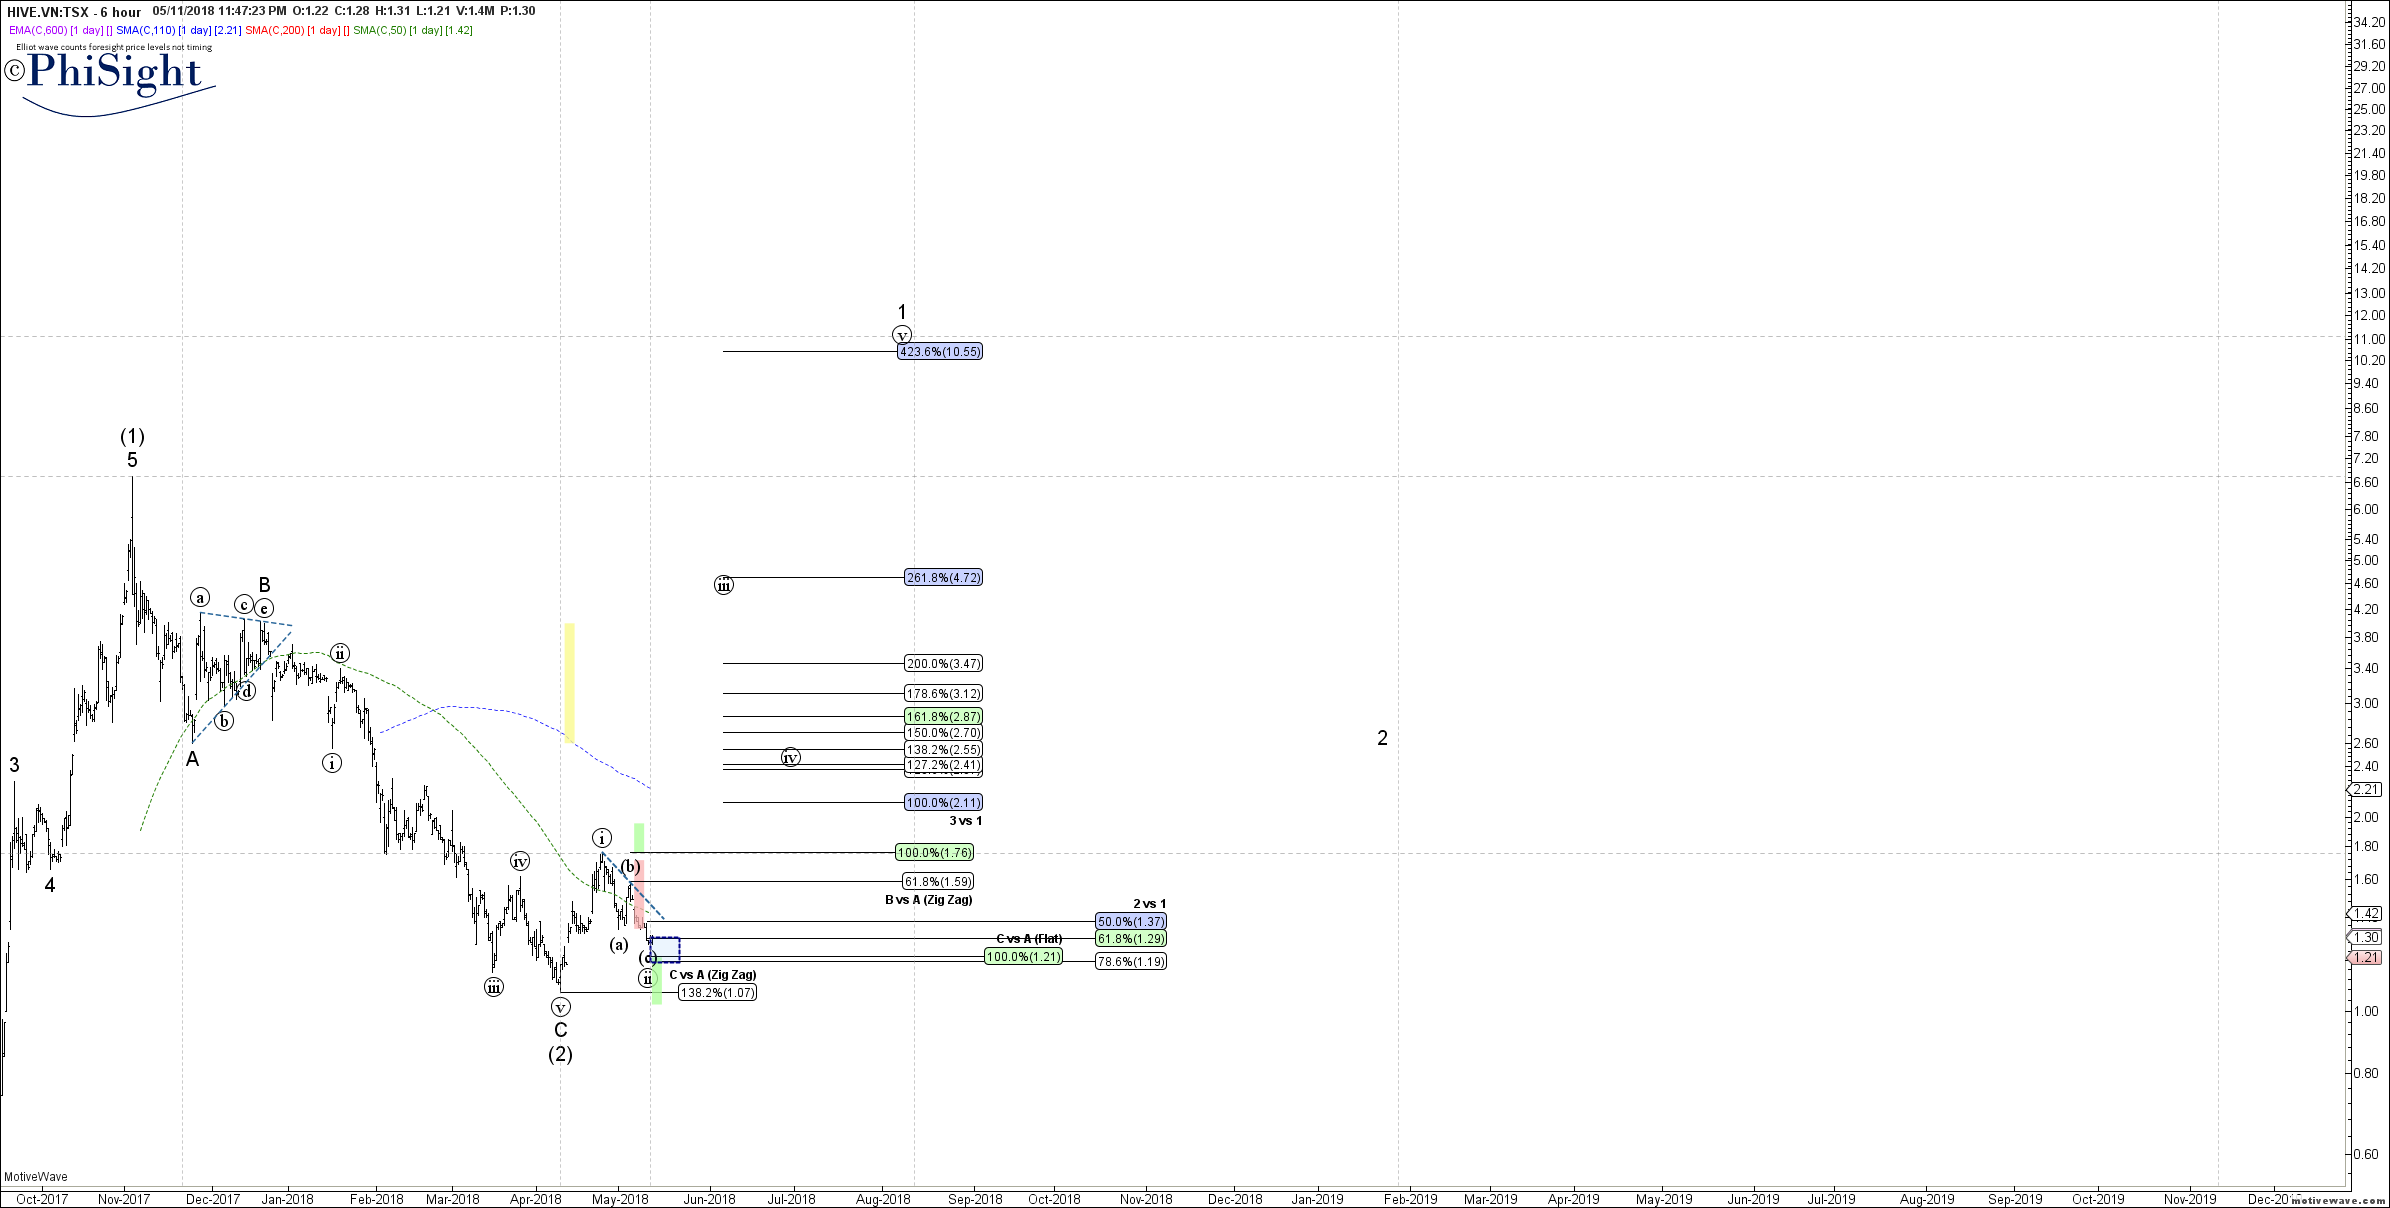.png) 3) 30 minute chart 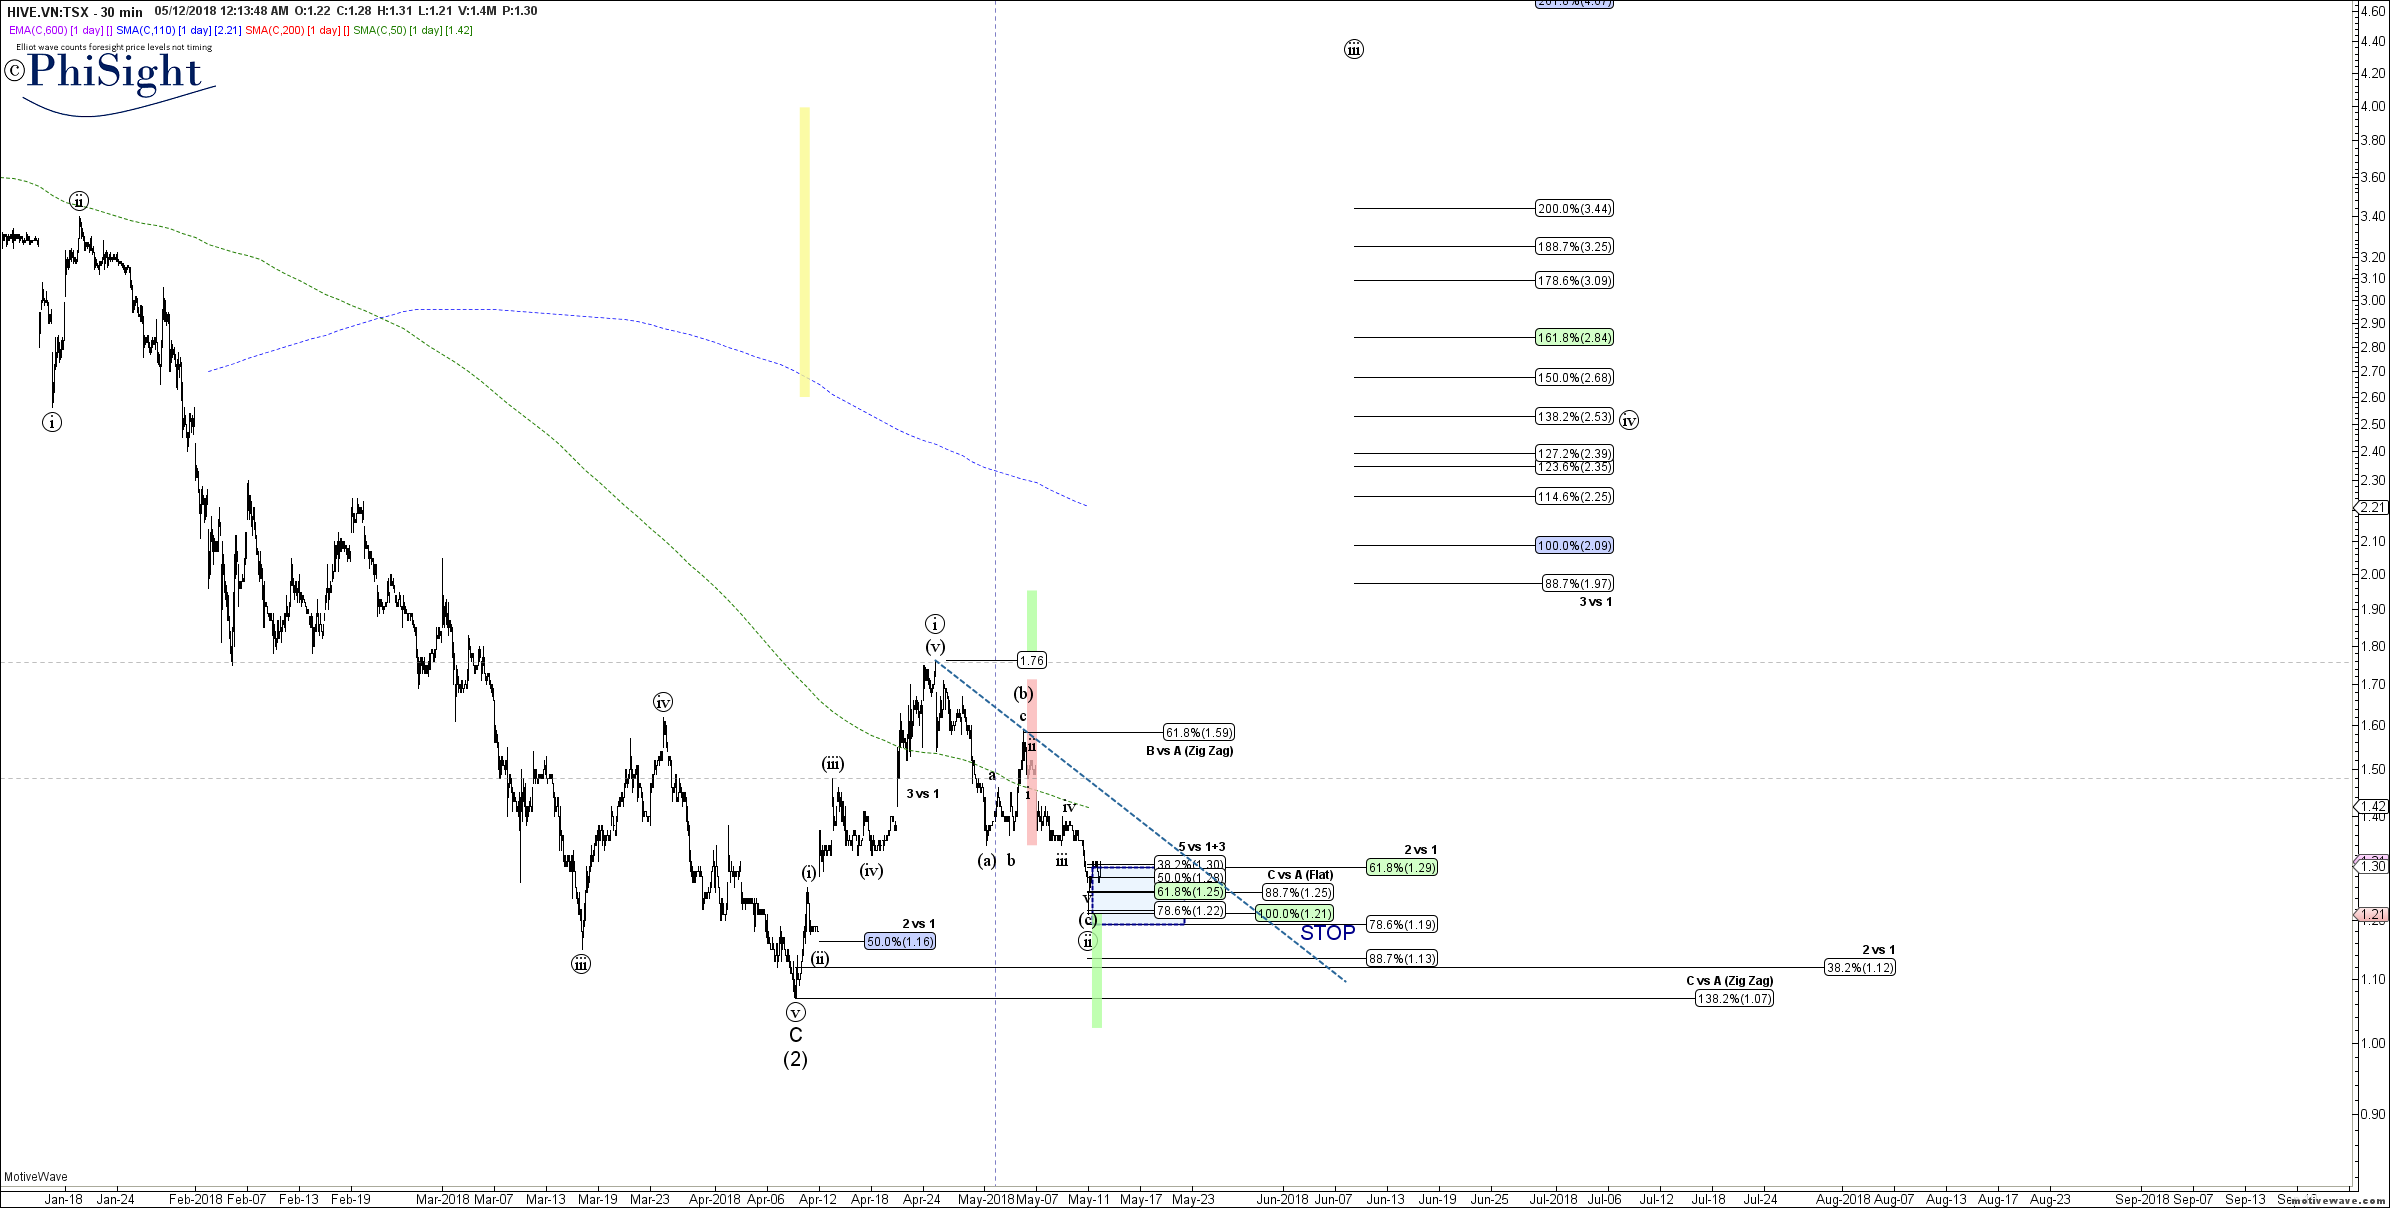.png) 4) 10 minute chart 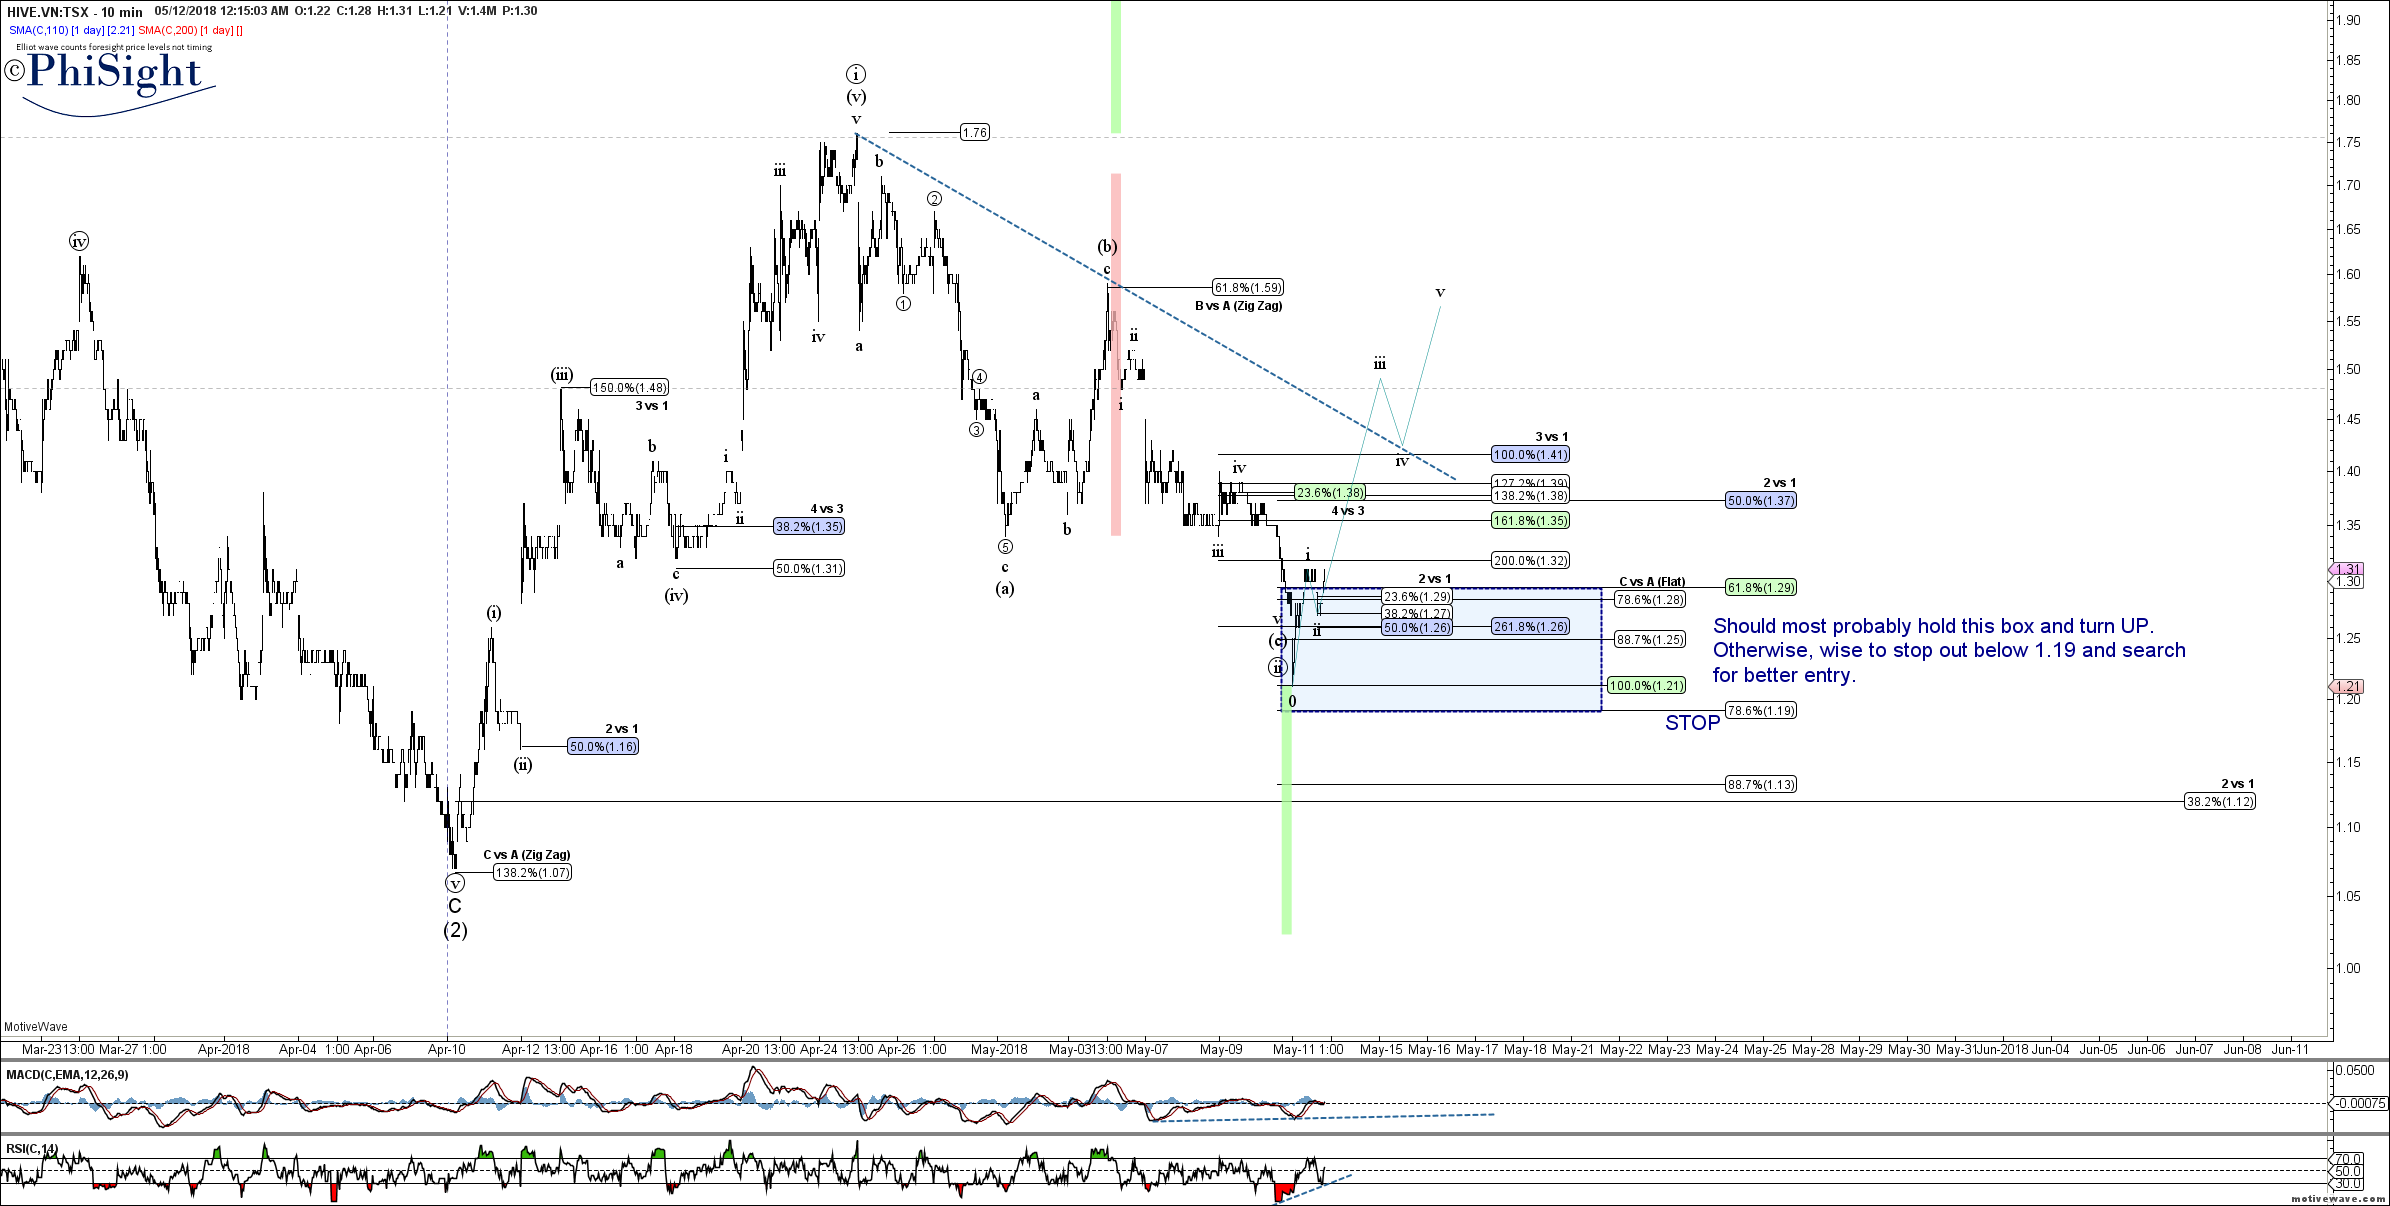.png) On this 10 minute chart, as an educational teaching moment, the price correction in wave 2 hit the 0.618 retrace, and the C=A level at 1.21 on the dot and rebounded in what looks like a micro impulse developing. So a stop of 1.2, just below the past wave 2, would be a very tight but reasonable stop. I had started tracking this stock on my twitter feed https://twitter.com/phisight618/status/992294881006469120 where one can assess the uncanny accuracy with which I was able to track the price of this stock. The US exchange ticket HVBTF chart is also presented here: 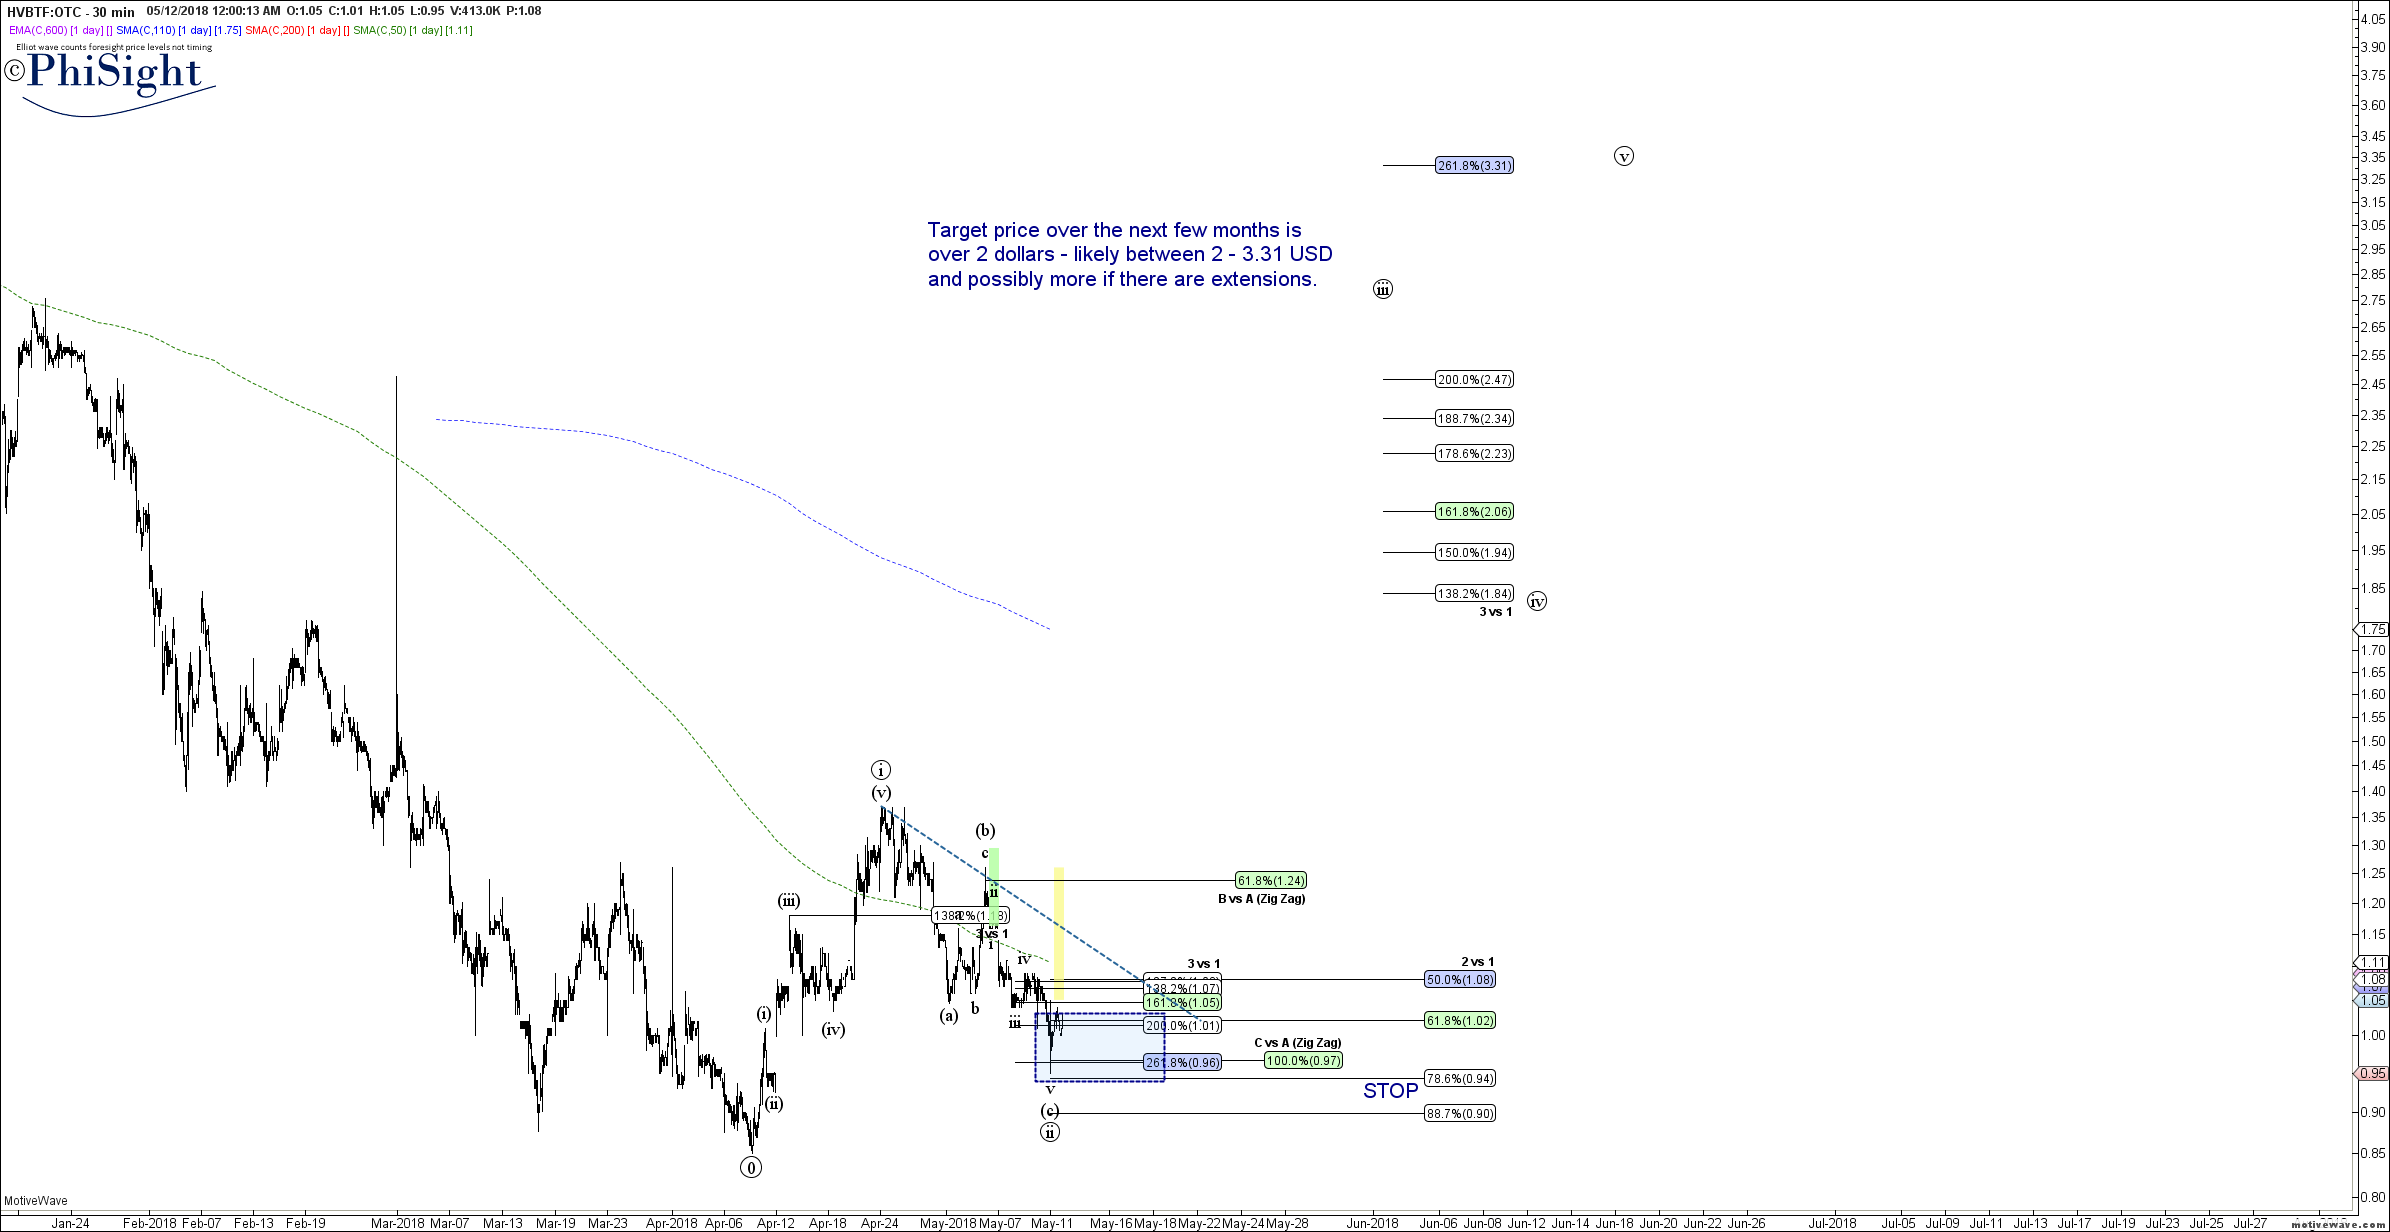.png) In a nutshell, using Elliot waves, quantitative Fibonacci levels, and my vast experience in technical analysis, I believe that this stock has most probably bottomed in a larger degree wave 2 as well as a smaller degree wave 2. Hence, in Elliot wave setup, the backing of two degrees of impulsive waves provides a high confidence entry, with a tight stop. I prefer to use a stop just below the 78.6% retrace as wave 2 corrections rarely go below that level and STOPs are a must in my opinion to cut losses fast if the price action does not conform to the expectation. Here's wishing everyone success in their trading. If you like the post, please leave me a note, resteem it in your circle and an upvote would be greatly appreciated. I welcome your comments and suggestions for improvement - please do feel free to let me know how I can make these posts more useful for you. Disclaimer: I am blogging these ideas for educational and informational purposes only. Please consult your financial adviser(s) and do your own due diligence before any trading activity. This post is not a soliciation to buy or sell anything!