Ethereum Price Analysis (With Some FA Sprinkled In)
ethereum·@proofofresearch·
0.000 HBDEthereum Price Analysis (With Some FA Sprinkled In)
# Ethereum Price Analysis (With Some FA Sprinkled In)  # Etheruem Fundamental Analysis Some may remember me writing about this before, but there were some major issues on the Ethereum network in relation to this claim made by a Twitter user before: This was covered in a previous Ethereum Market Analysis (which is once again down thanks to Medium suspending my account continuously). No matter. Let’s check out the status of the network again via [https://dappradar.com](https://dappradar.com/) # Ethereum Network Looks Relatively Healthy At the Moment 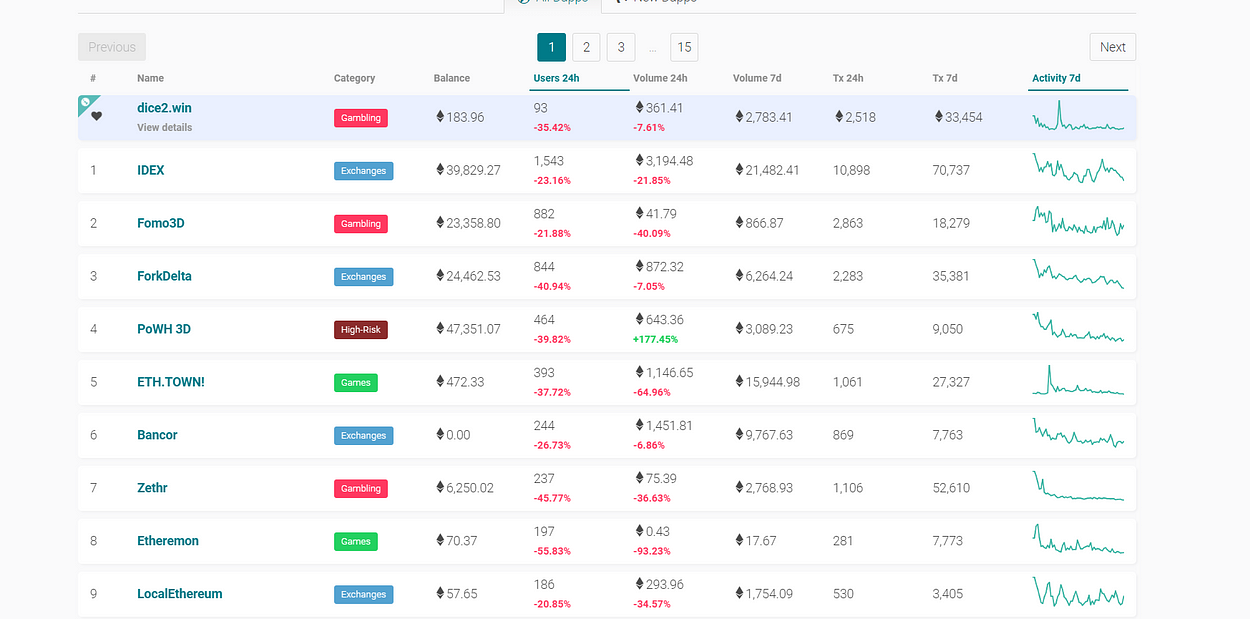 Source: [https://dappradar.com/dapps](https://dappradar.com/dapps) IDEX is #1 on this list, which is something that you want to see if you’re an Ethereum fan. Although it’s worth noting that the price of the protocol has been getting drowned over the last few weeks (we’ll get into that a bit later). ## **_However, there are some troubling things worth noting:_** 1. High-Risk dApps are still getting a LOT of TXs on the chain. 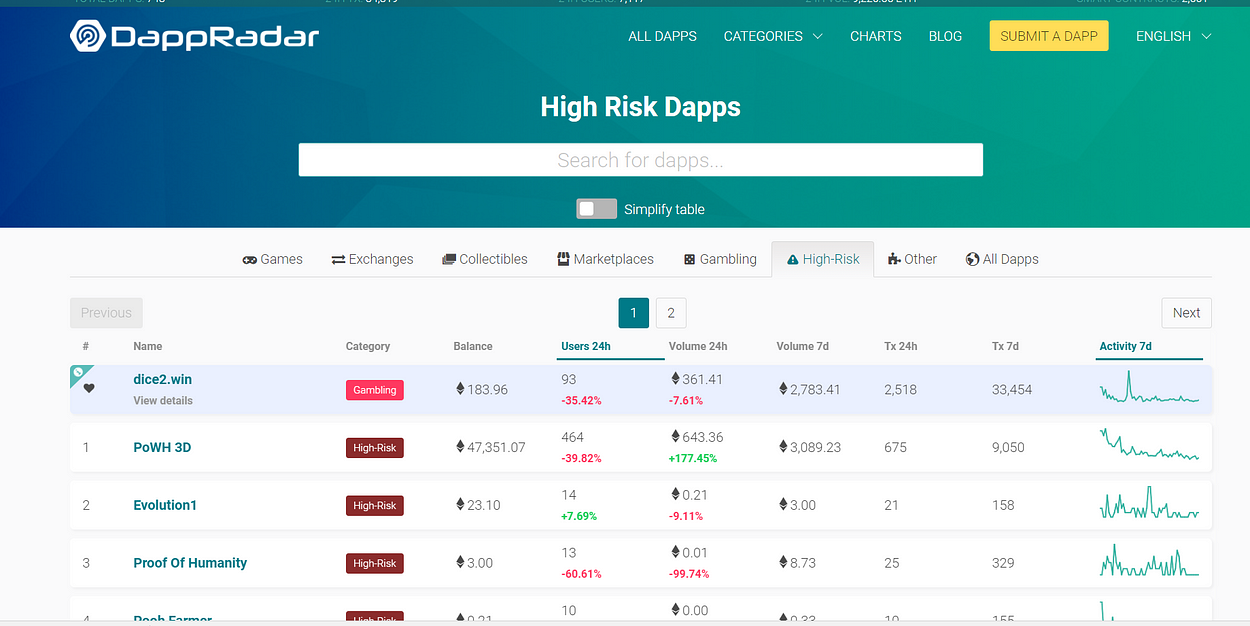 Source: [https://dappradar.com/category/high-risk](https://dappradar.com/category/high-risk) 2. In addition, the overall amount of TXs/24 hours are down substantially. # Ethereum Appears to be Stagnated in its Development Progress While this looks optimistic, they are a **_long, long ways away, and that’s more time that Etherum holders continually become antsy_**. [**Ethereum Sharding Biweekly Development Update # 10— Prysmatic Labs** _Latest Research_medium.com](https://medium.com/prysmatic-labs/ethereum-sharding-biweekly-development-update-10-prysmatic-labs-ea068d86c54a "https://medium.com/prysmatic-labs/ethereum-sharding-biweekly-development-update-10-prysmatic-labs-ea068d86c54a")[](https://medium.com/prysmatic-labs/ethereum-sharding-biweekly-development-update-10-prysmatic-labs-ea068d86c54a) ## Vitalik Has a Lot of Internet Time Perhaps this criticism will piss people off, but it’s just a fact. It looks like Vitalik spends a substantial amount of time on the internet, which is problematic when considering the fact that its survival is contingent upon being able to scale in a safe and logical manner. Here is a recent interview that Vitalik did: [**Vitalik Buterin on Cryptoeconomics and Markets in Everything (Ep. 45)** _Is he secretly the best young economist today?_medium.com](https://medium.com/conversations-with-tyler/vitalik-buterin-tyler-cowen-cryptocurrency-blockchain-tech-3a2b20c12c97 "https://medium.com/conversations-with-tyler/vitalik-buterin-tyler-cowen-cryptocurrency-blockchain-tech-3a2b20c12c97")[](https://medium.com/conversations-with-tyler/vitalik-buterin-tyler-cowen-cryptocurrency-blockchain-tech-3a2b20c12c97) Among other things…. But let’s get to these charts! # Ethereum Price Analysis We’ll start with the ETH/BTC pair because that tells a more accurate story of how much the price of this crypto has been getting throttled in the markets lately. **_Let’s go back to May 5th, 2018 (where the market was at its last peak, MC-wise)._** 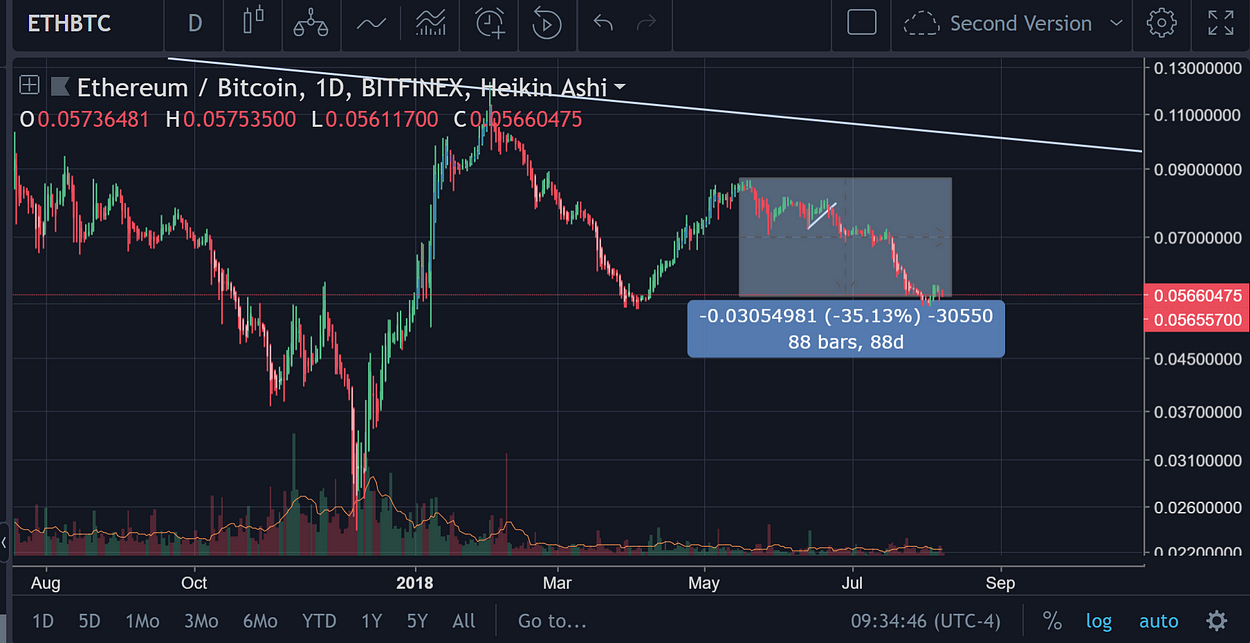 Thus far the price has depreciated against $BTC by 35.13% since that point, which is saying a lot considering the fact that $BTC has dropped substantially in the same amount of time: 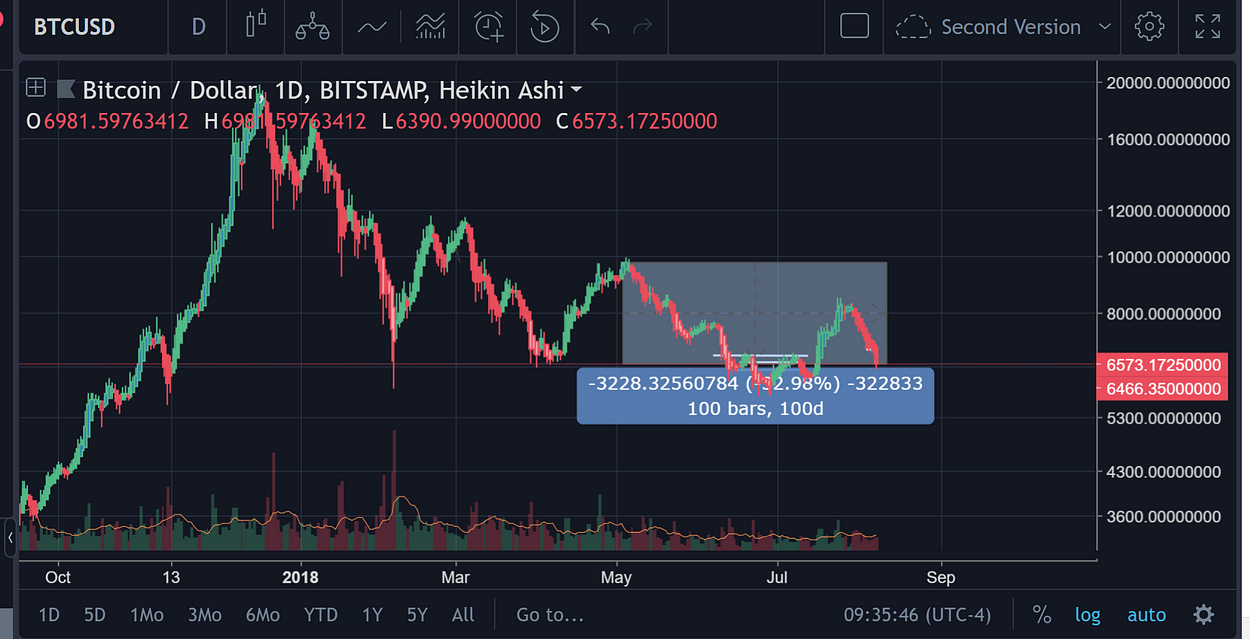 Now, let’s take a look at the USD price movement in recent hours/days with the 4H chart.  Currently, the price is nudging against a **_very long-term support on the daily chart_**. This is good news if you happen to be someone that’s looking for a potential entry in the market. However, be warned! $XRP was nudging against a pretty long-term support level and that broke recently to drop it below $0.40. 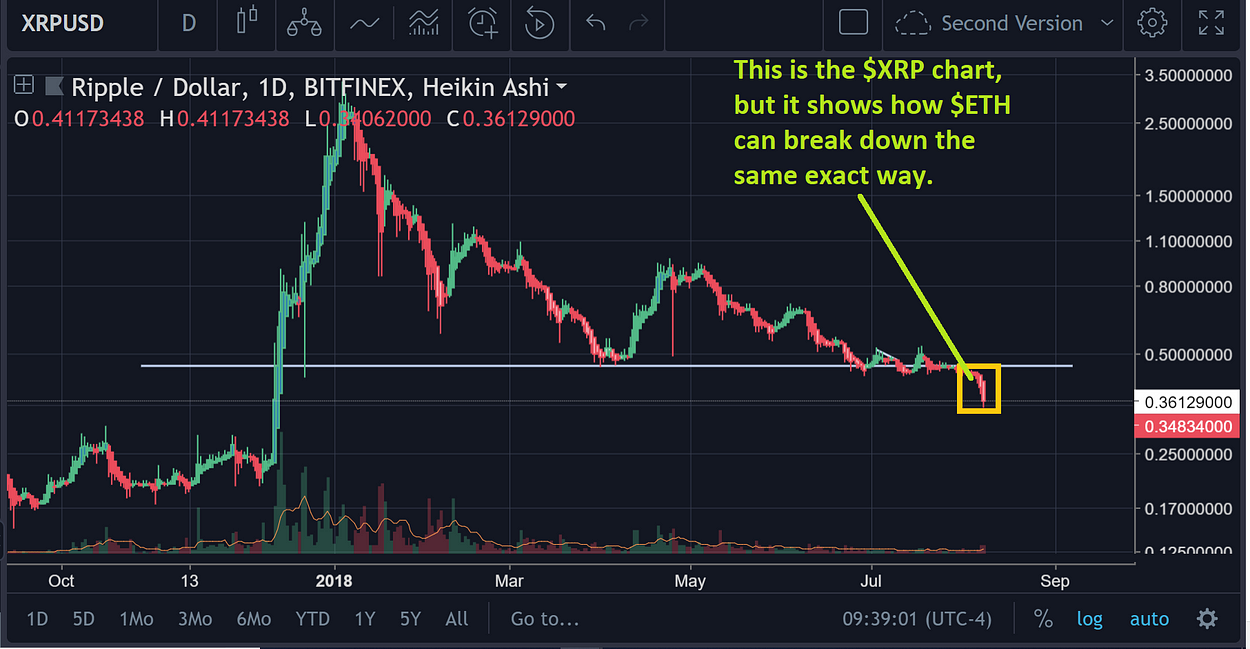 Above is the XRP chart for anyone that needed a refresher or a quick example of what can happen. 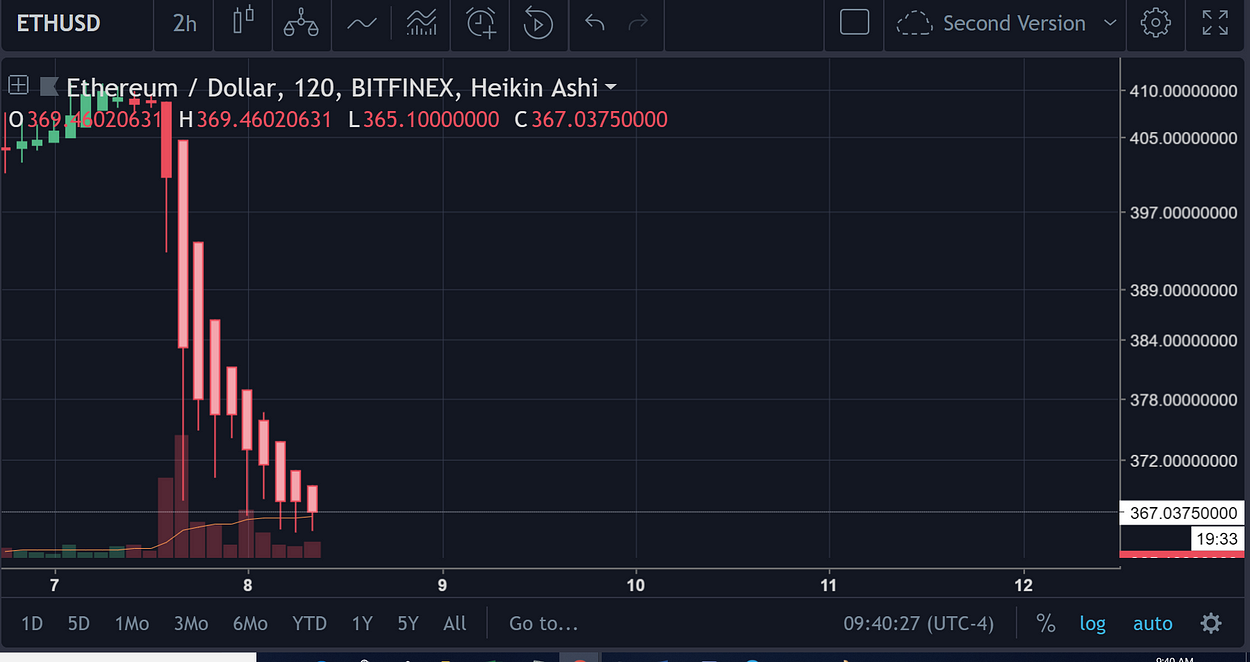 This is the 2H chart above ^ On here, it does **_appear as though the downward momentum on the price is beginning to wane to some extent_**. 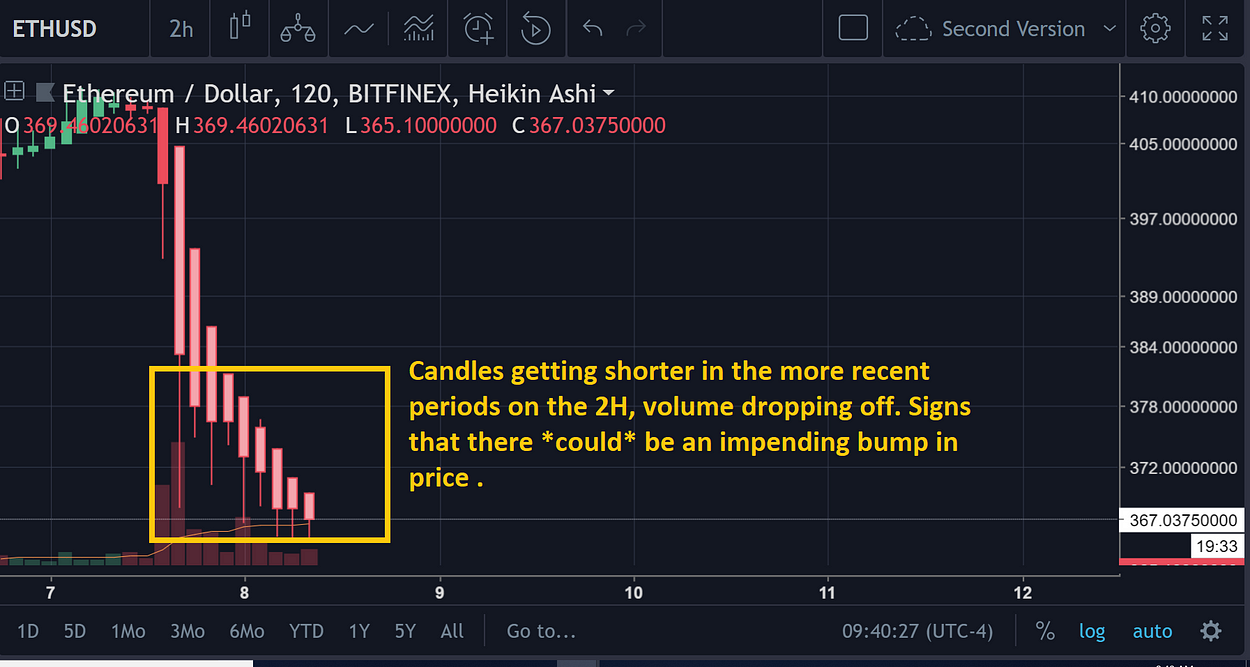 Mix this with the fact that the RSI is oversold, and you got a concoction for a **_potential increase in the price soon._** Let’s see if we can spot any divergence in the RSI first though. # Relative Strength Index (14) 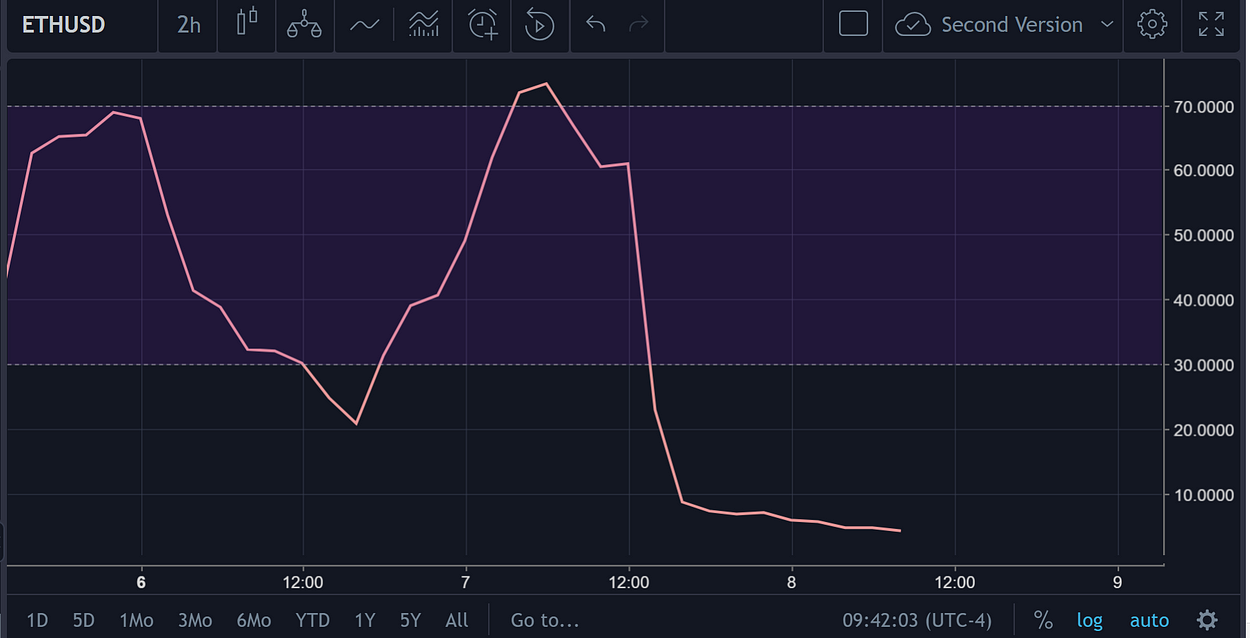 Nope. none. $ETH is getting throttled here too. Let’s see if there happens to be **_any on the 1H charts at least._**  Bingo, it is there. However, the divergence is so ‘small’ (for lack of a better word), that it has not shown up on **_any larger time frames._** # Conclusion Long-term, there doesn’t seem to be an apparent reason for why Ethereum would break out in terms of price in any large way (barring some manipulation, but even that appears to be largely event driven these days). Thus, it’s an iffy and difficult coin to make a definitive decision on at this **_very second_**. However, it has potential. It appears as though the entire market is beginning to move sideways a bit after dropping so substantially in value over the last 24–48 hours and 7 days, in general. Only time will tell! If it does move up in value then the $400–410 price range will be the next **_major resistance point for $ETH_**. There’s no telling with these markets though!