Evolution 101 #3 - Random Events in Evolution, Genetic Drift
steemstem·@scienceangel·
0.000 HBDEvolution 101 #3 - Random Events in Evolution, Genetic Drift
In the previous [Evolution 101 post](https://steemit.com/steemstem/@scienceangel/evolution-101-2-genotype-phenotype-genes-alleles-and-population-genetics-model) we learned about allele and genotype frequencies, and that in hypothetical Hardy–Weinberg populations allele frequencies do not change throughout generations. However, in real life populations that's almost never the case, and allele frequencies do change. The following fundamental mechanisms of evolution may cause changes in allele frequencies in population: * **Genetic drift** * **Natural selection** * **Mutations** * **Migrations (gene flow)** Genetic drift and natural selection represent two most important forces of evolutionary change, and will be explained in more detail in this and in the next post. ## Genetic drift or dice rolling Genetic drift is by definition an evolutionary mechanism that induces **random changes** in **allele frequencies** in a population from generation to generation. The resulting change in allele frequencies happens because of "sampling error" during the process of allele selection from the gene pool that will participate in forming of next generation. The effect of genetic drift is especially pronounced in **small populations**. Genetic drift, sampling error, gene pool, random events, small populations - seriously, what are you talking about? This doesn't seem like evolution at all!  *Genetic drift is a stochastic process, same as dice rolling* ### Random sampling in genetics Let's explain the concept of random sampling first, to be able to understand stochastic nature of genetic drift. Imagine that you have a bowl of 100 blue and 100 red marbles - 200 marbles total, and that you have to draw 100 marbles with your eyes closed and transfer them into new bowl. After each draw, you count the number of blue and red marbles, calculate the proportion, add the marbles to total number of 200 again in such way that the drawn proportion of blue and red marbles is preserved and you draw again. 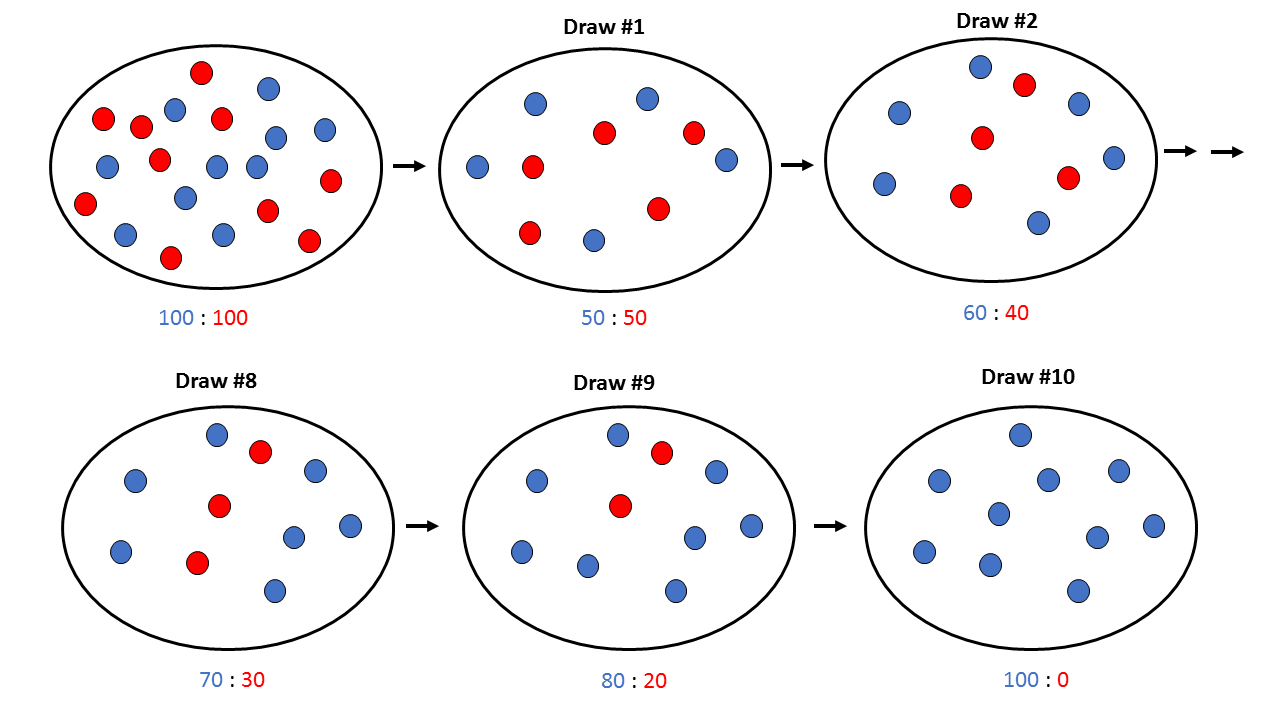 After enough draw-refill cycles (in this example 10), you will notice that you have only blue marbles left in the bowl! The red marbles failed to preserve themselves due to chance, or sampling error. The exact same thing happens with gene alleles in populations - simply because of the sampling error, some alleles can be drifted out of the population, and gone for good. Let's take a look what happens if we initially have 20 marbles total (10 blue and 10 red) and we need to draw 10 of them.  Notice how quickly you ran out of the red ones - after only couple of draw-refill cycles! The same happens in small populations - they experience more drastic effect of genetic drift compared to large populations. Good example for this are endangered species, because they have small populations sizes and the loss of alleles due to genetic drift pose a big problem for them. ### Genetic drift and allele frequencies We should make the genetic drift story more concrete by taking an example. Imagine that we have small population of rabbits made up of 8 brown rabbits and 2 white ones, with equal allele frequencies (p = q = 0.5). 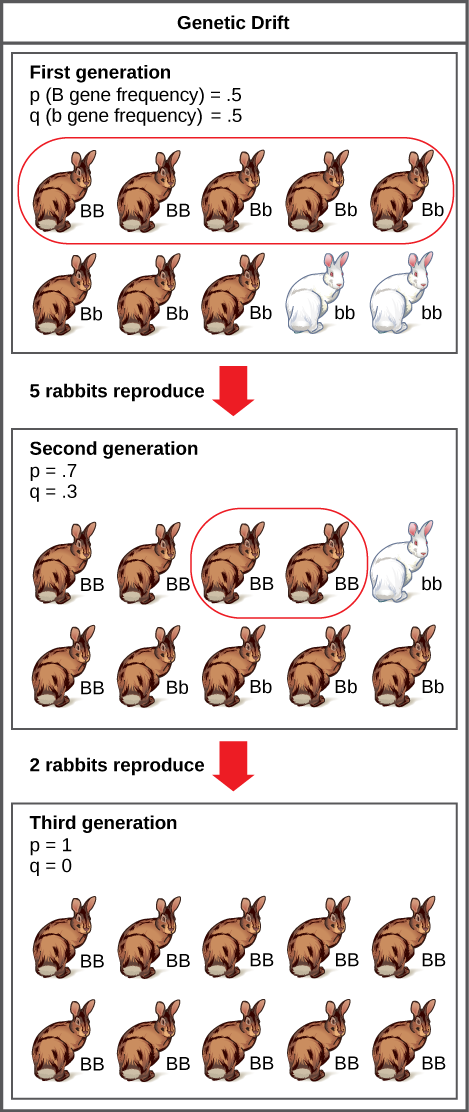 Image credit: ["Population genetics: Figure 2,"](https://cnx.org/contents/yNlSxj0E@5/Population-Genetics) by OpenStax College, Biology [CC BY 3.0](https://creativecommons.org/licenses/by/3.0/) We can also imagine that from the first generation (F<sub>1</sub>) only 5 brown rabbits reproduce and the rest of them don't, because they happened to get shot by hunters (random event, hunters did not have preference for coat color). In the F<sub>2</sub> generation allele frequencies will be changed (p = 0.7, q = 0.3). If now, for some reason, only two rabbits with BB genotypes reproduce, in the F<sub>3</sub> generation allele b is not present anymore (q = 0) and the only allele left is B (p = 1). When the frequency of an allele becomes 1, it means that the allele is **fixed** within a population and all individuals in the population have the same allele at the particular gene locus. The other allele, allele b, is lost from a population (has been drifted out), and it's frequency is now q = 0. This is the extreme example, where one allele is being fixed and other is completely lost. The general rule of genetic drift is that alleles with small initial frequencies have more chance of being lost in small populations, than alleles that occur in higher frequencies. **This example perfectly illustrates the influence of genetic drift on populations - genetic drift decreases genetic variation within a population.** ### What is the probability for allele fixation? Genetic drift is best discussed in light of **neutral alleles**. Neutral alleles are those alleles that are not "recognized" by natural selection (more on that topic in next post!), and for which we should expect to have frequencies defined by Hardy–Weinberg principle:  However, in practice, in every generation, there is a chance for particular allele frequency to increase, decrease or to stay constant, simply as a consequence of genetic drift, in the way it is explained above. In a population of size N there will be total of 2N alleles at each locus. Since the process of genetic drift is totally random, each of the 2N alleles in that population will have an equal chance of being the "chosen one", or fixed. This means that chance for fixation of any allele in population can be defined in following manner:  Likewise, chance that any allele will be lost as a consequence of genetic drift is:  ### How can we measure genetic drift? To do that, we need to define **effective population size (N<sub>e</sub>)** first. Effective population size represents the number of interbreeding individuals in a population who will produce offspring for the next generation. In other words, it represents the size of ideal H-W population which will be affected by the genetic drift in the same way as analysed, real population. As you can imagine, N<sub>e</sub> values are usually lower than the numbers of actual breeding individuals in population (**N**):  **Nm** - number of males **Nf** - number of females For example, in a population with 20 males and 20 females capable of breeding, the effective population size is 40 - equal to actual population size. However, imagine population of 100 individuals, with 96 females and only 4 males (harem polygamy in animals) - N<sub>e</sub> in such population is 15.36, which means that such population, although it has 100 individuals, suffers from the effects of genetic drift in the same way as population of 15 individuals! Now we can calculate how much genetic drift we can expect after one generation for diploid organisms:  V(p<sub>1</sub>) - variance in the frequency of an allele p, q - frequencies of alleles at gene locus of interest This basically means that the effect of genetic drift depends on **genetic variability** of population (p, q - allele frequencies) and the **effective population size**. If p = q = 0.5 and N<sub>e</sub> = 50 then V(p<sub>1</sub>) = 0.0025, the change in allele frequency in each generation will be: p = (0.0025)<sup>0.5</sup> = 0.05, or 5%. In a small size population of only 5 individuals the effect of genetic drift will be stronger: p = q = 0.5 and N<sub>e</sub> = 5 then V(p<sub>1</sub>) = 0.05 p = (0.05)<sup>0.5</sup> = 0.22, or 22% of random changes in allele frequencies in each generation! ### Genetic bottleneck and founder effect Initially large population number can be decreased drastically by the processes of **genetic bottleneck** and **founder effect**. 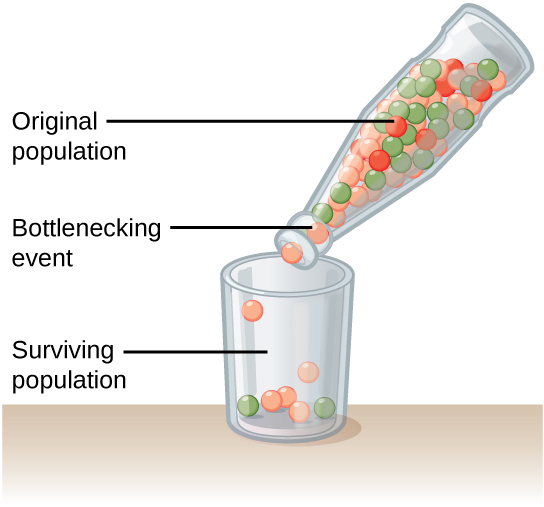 Image credit: ["Population genetics: Figure 3,"](https://cnx.org/contents/yNlSxj0E@5/Population-Genetics) by OpenStax College, Biology [CC BY 4.0](https://creativecommons.org/licenses/by/4.0/) Bottleneck effect happens usually when some natural disasters occur, which can kill, in a complete random way, a large portion of individuals of a population. After such event, genetic structure of a population is usually drastically changed, with survivors who now carry the complete gene pool which is significantly reduced compared to previous large population. Another scenario in which population would "feel" the strong effect of genetic drift is when one small part of the original population migrates to colonize new territory, carrying only portion of alleles from original population, in other words - those individuals are not representative of entire population. This is called **the founder effect**. 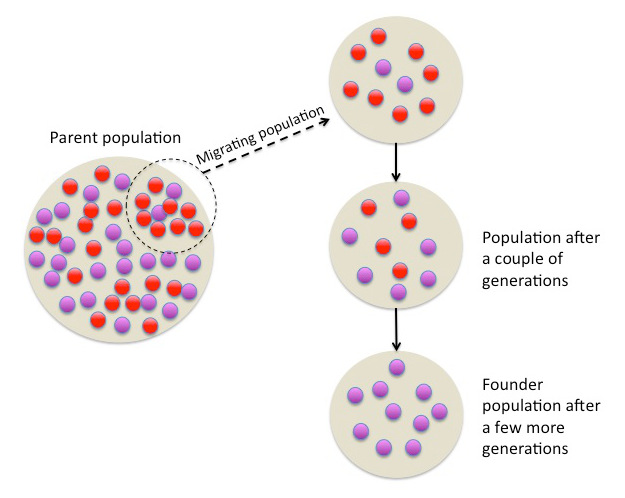 Image credit: [Wikimedia Commons, Figure Founder_effect_Illustration](https://commons.wikimedia.org/wiki/File:Founder_effect_Illustration.jpg) by Tsaneda [CC BY 3.0](https://creativecommons.org/licenses/by/3.0/) -------------------- Today we learned what are the random events in the process of evolution and how do they influence the allele frequencies change in population. Next time we'll see what is natural selection and how it changes the population structure. Until then, relax and keep steemSTEM! ;) ---------------------- Literature [Mechanisms of Evolutionary Change](http://nectunt.bifi.es/to-learn-more-overview/mechanisms-of-evolutionary-change/) [Effects of genetic drift](https://evolution.berkeley.edu/evolibrary/article/side_0_0/genesdrift_01) [Population Genetics](https://cnx.org/contents/yNlSxj0E@5/Population-Genetics) [Genetic drift](https://www.khanacademy.org/science/biology/her/heredity-and-genetics/a/genetic-drift-founder-bottleneck) [Evolution, Mark Ridley, 3rd Edition](http://www.biologia.buap.mx/Evolution__3rd_Edition.pdf) [Effective population size and patterns of molecular evolution and variation](http://www.nature.com.gate2.inist.fr/articles/nrg2526) [Population Genetics](https://courses.lumenlearning.com/boundless-biology/chapter/population-genetics/) ---------------------- *Image credits pixabay.com and myself, unless otherwise stated* -------------- #### For more scientific-related content check [steemSTEM](https://steemit.com/trending/steemstem). Follow me if you like my posts and want to read some more ;) If you have any thoughts/suggestions fell free to leave a comment! <center> </center><center> Image credits: [Jason Brooks](https://www.jason-brooks.com/) and [Prof. Sharona Even-Ram](https://medicine.ekmd.huji.ac.il/En/Publications/ResearchersPages/pages/sharonaev.aspx)</center>
👍 scienceangel, zest, purepinay, team, bachuslib, alexs1320, lisa.palmer, remlaps1, steemstem, anarchyhasnogods, lafona-miner, justtryme90, mobbs, lemouth, the-devil, robotics101, foundation, himal, lamouthe, nitesh9, rachelsmantra, kerriknox, rockeynayak, gra, rjbauer85, kryzsec, sci-guy, mrs.agsexplorer, grandpere, timsaid, timothyb, jamhuery, alexander.alexis, ovij, somethingburger, kedi, amavi, dber, gentleshaid, mystifact, kenadis, carloserp-2000, hadji, fredrikaa, abigail-dantes, ksolymosi, leczy, ertwro, juanjdiaz89, churchboy, pharesim, dna-replication, curie, locikll, anwenbaumeister, hendrikdegrote, rayken04, kushed, steem-id, cebymaster, dickturpin, dreamien, rscalabrini, drmarysawdon, velourex, steemedia, voronenka, cotidiana, teofilex11, bp423, redpillproj, cryptonator, steemtaker, hrissm, olaleke, vladimir-simovic, bue, salvadorcrg, teamhumble, marty-arts, dreamarif, jaeydallah, yann85, delph-in-holland, nwjordan, mcw, sco, masterwriter, dysprosium, zoricatech, suesa, paultarpan, ribbitingscience, yu-stem, cheva, steemstem-bot, dejan.vuckovic, rcebike, altherion, archeothot,