Steem Statistic Charts Week 03
steem·@sevenseals·
0.000 HBDSteem Statistic Charts Week 03
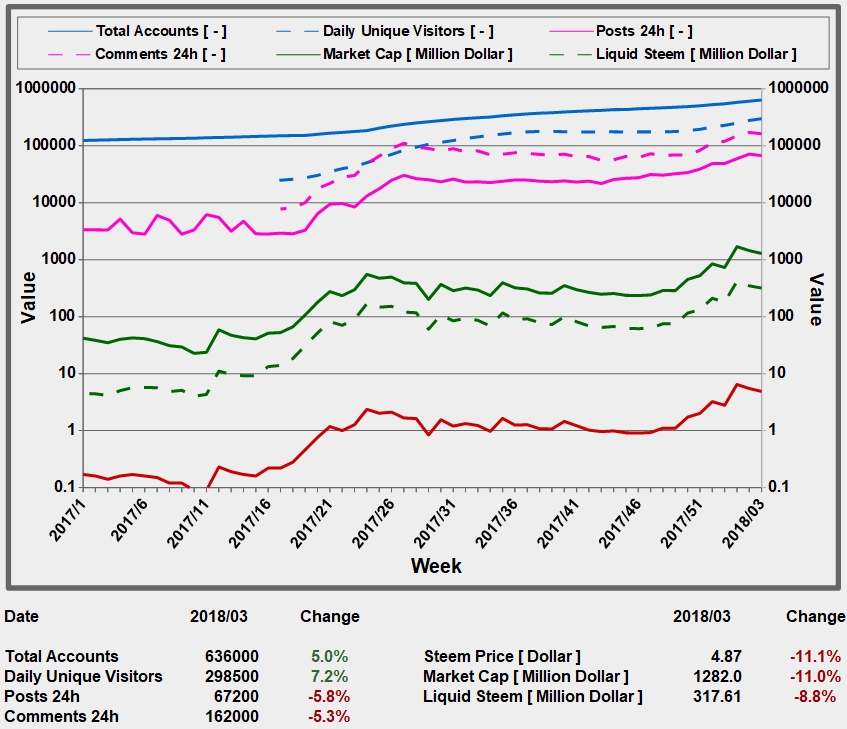
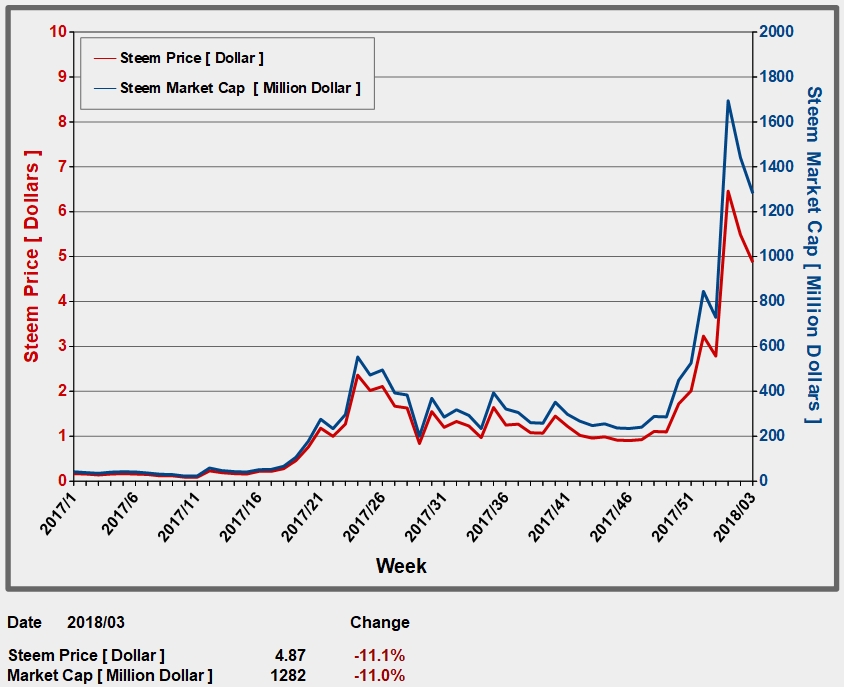
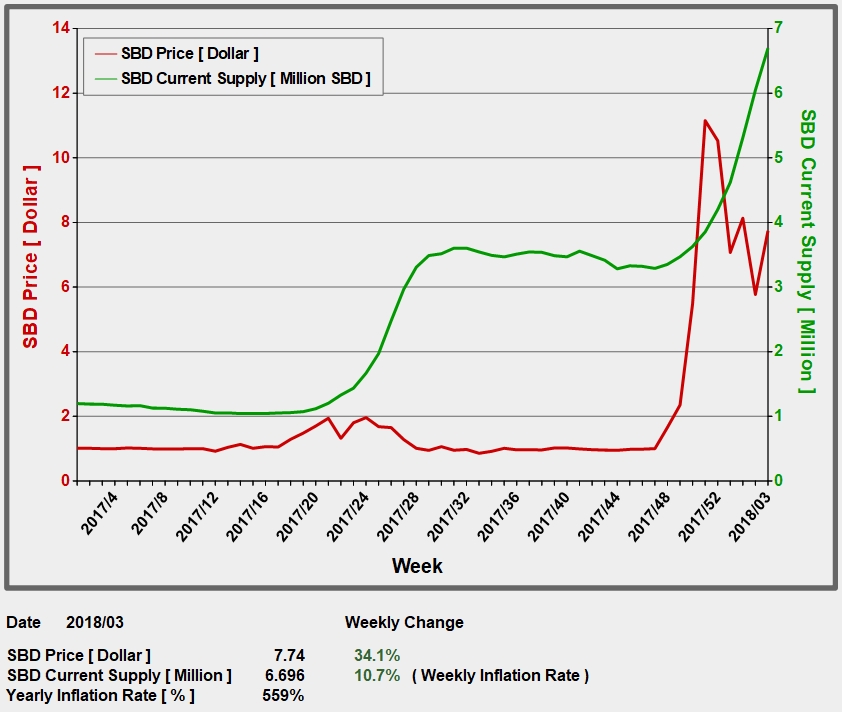
Here are my weekly Steem statistic charts. In the third week of 2018, price of Steem decreased by 11% while the SBD price increased by 34%. Thanks to the speculators for the higher payouts to the authors. :-) SBD inflation is now 10.7% weekly. Steemit activity values went down a little bit, but total accounts and daily unique visitors continued to rise. ### All-In-One-Chart The all-in-one-chart shows all activity values and monetary values in logarithmic scaling where you can see the correlation between the curves. ####  # ### Steem Price Chart The following chart shows the steem price and market capitalization in linear scaling. ####  # ### SBD Chart The following chart shows the SBD price and SBD supply in linear scaling. The inflation rate of SBD is now 10.7% weekly. ####  # *If you have some advice to improve the charts, please let me know.* # Here are the links to my last five weekly statistics: https://steemit.com/steem/@sevenseals/steem-statistic-charts-week-02 https://steemit.com/steem/@sevenseals/steem-statistic-charts-week-01-revised-version https://steemit.com/steem/@sevenseals/steem-statistic-charts-week-53 https://steemit.com/steem/@sevenseals/steem-statistic-charts-week-52 https://steemit.com/steem/@sevenseals/steem-statistic-charts-week-51 # ----------- Comments will be voted. -----------!
👍 aherbil, masterthematrix, sevenseals, irgendwo, sonny.dharmawan, hr1, kil, chinchilla, goldkey, minnowsupport, walkingkeys, lauch3d, brains, forexbrokr, peacefulpatriot, draffanahmed, resteem.bot, rizvy, dimtzoumas, whalepunk, robertking, erwinlottemann, rosch, ozoo, midnas-howler, minnowhelper, vladimir-simovic, gbd, laxam,