SteemChain - Charts & Analytics V1.3.0
utopian-io·@steempytutorials·
0.000 HBDSteemChain - Charts & Analytics V1.3.0
#### Repository
https://github.com/Juless89/steem-dashboard
#### Website
http://www.steemchain.eu
https://steemitimages.com/640x0/https://cdn.steemitimages.com/DQmZF45smbQ5iJHtAWBF2EawvAcnFHxqBLMeuDS2DtT4Qcz/Screenshot%202019-03-04%2008.23.54.png
#### What is SteemChain?
SteemChain in an open source application to analyse transactions and operations from the STEEM blockchain. Store these into a MySQL database and visualise with charts and tables via the web. Looking to bring data analytics to STEEM like websites as [blockchain.com](https://www.blockchain.com) do for Bitcoin.
### New Features
#### Removed minute and hour resolution for now, added 365D delta
Commit: [455da0dea3d03be4ce1f40316a666c3e21b2d012](https://github.com/Juless89/steem-dashboard/commit/455da0dea3d03be4ce1f40316a666c3e21b2d012)
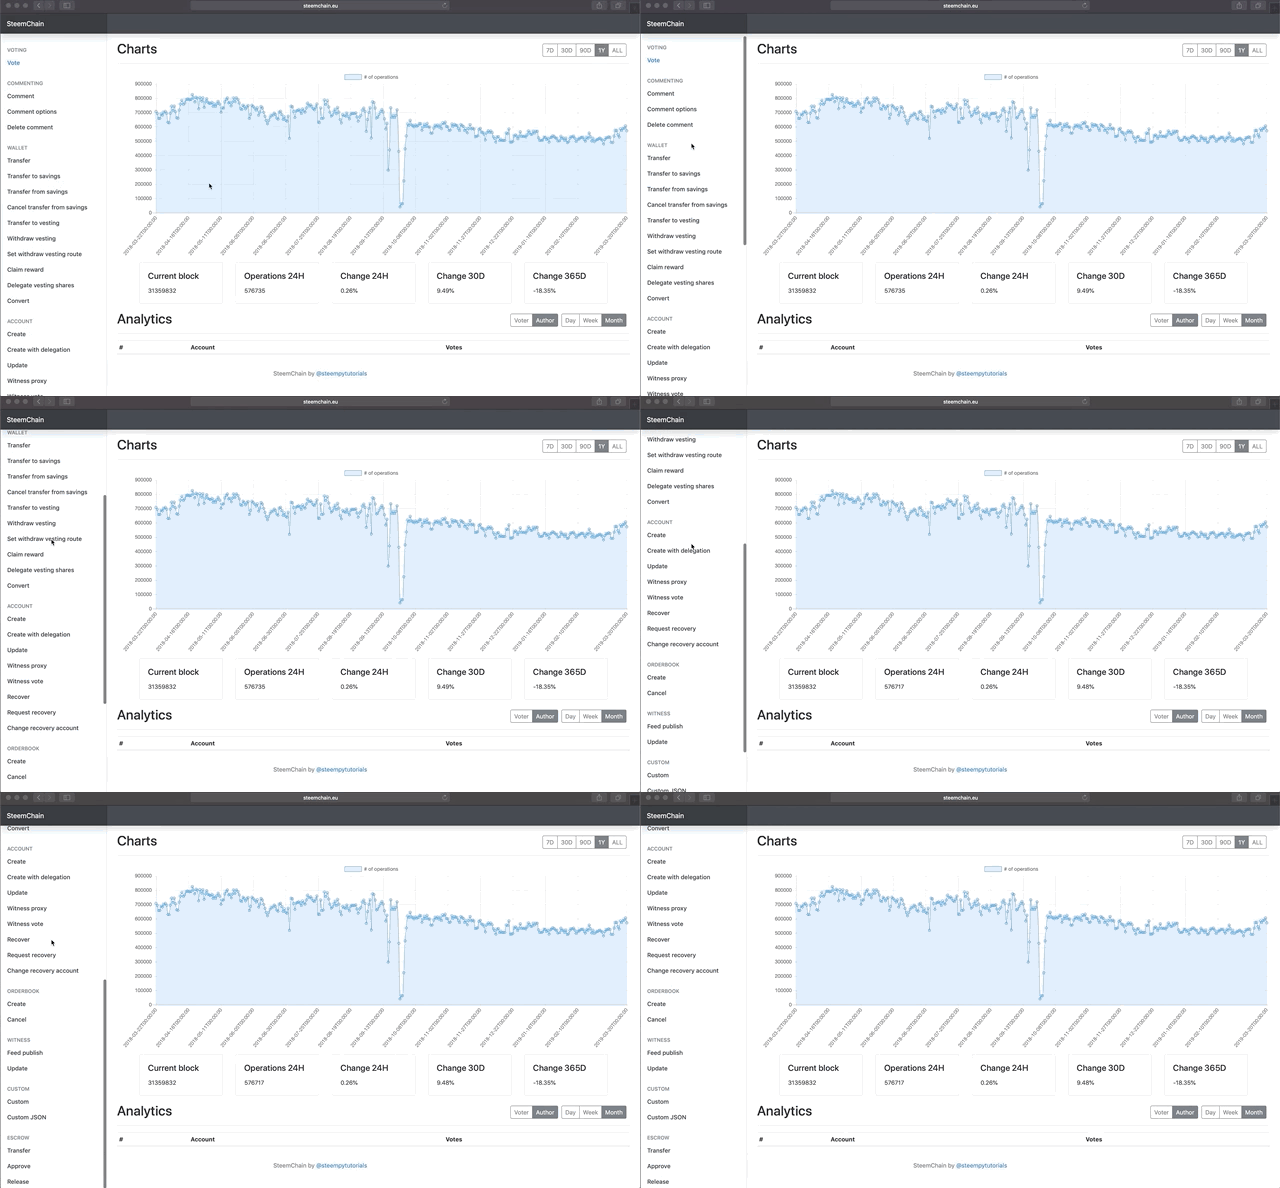
As Chart.js is not suited to handle large amounts of data points, for now the minute and hour resolution have been removed. The default is set to day. The periods have also been adjusted to accommodate this change. In addition a 365 day delta has been added.

#### Added all operations types to the front-end
Commit: [ce036d351e571cd01e3012274158c98d339a90a2](https://github.com/Juless89/steem-dashboard/commit/ce036d351e571cd01e3012274158c98d339a90a2)
To enable easy scaling to all operation types a dynamic view has been created to retrieve chart data. All variables are retrieved from the path.
```
# front-end/api/urls.py
path('<slug:type>/<slug:delta>/<slug:period>', CountData.as_view()),
# front-end/api/views.py
# API for count chart data
class CountData(APIView):
# Unused user authentication classes
authentication_classes = []
permission_classes = []
def get(self, request, format=None, *args, **kwargs):
# get resolution, period and operation type
delta = kwargs['delta']
period = kwargs['period']
operation = kwargs['type']
end = datetime.now()
# get operation count model
self.model = get_model_count(operation)
# calculate start
start = get_start_day(period, end)
# ALL or specific periode
if start:
ticker = self.model.objects.filter(timestamp__range=(start, end)).order_by('timestamp')
else:
ticker = self.model.objects.all().order_by('timestamp')
serializer = VotesCount(ticker, many=True)
x = []
y = []
# Omit last result, append data into lists
for row in serializer.data[:-1]:
x.append(row['timestamp'])
y.append(row['count'])
# datastruct for response
data = {
"label": '# of operations',
"labels": x,
"data": y,
}
return Response(data)
```
The correct database model is retrieved by calling `get_model_count`. I was unable to figure out a way to dynamically link the operation to the correct model, as the models are classes. This resulted in rather large if/else statements.
```
# front-end/api/views.py
# return count model for operation type
def get_model_count(operation):
if operation == 'votes':
return votes_count_day
elif operation == 'transfers':
return transfers_count_day
elif operation == 'claim_rewards':
return claim_rewards_count_day
elif operation == 'delegate_vesting_shares_operation':
return delegate_vesting_shares_operation_count_day
.
.
.
```
Linking to each operation type has been made simple by maintaining the same naming scheme as the STEEM blockchain.
```
# front-end/templates/index.html
<li class="nav-item">
<a id="comment_operation" class="nav-link" href="/comment_operation">
<span data-feather="file"></span>
Comment
</a>
</li>
```
The operation type is then captured and send to the dynamic `OperationView` which uses a new dynamic `operation.html` to retrieve and plot the chart.
```
# front-end/pages/urls.py
path('<slug:operation>', OperationView.as_view()),
# front-end/pages/views.py
class OperationView(View):
def get(self, request, *args, **kwargs):
return render(request, 'operation.html')
```

#### Split up operations.py
Commit: [b3ab0619b678f0520b5d7f3aa6d335afe327341d](https://github.com/Juless89/steem-dashboard/commit/b3ab0619b678f0520b5d7f3aa6d335afe327341d)
As recommended `operations.py` has been split up into smaller more manageable files.
```
operations_account.py
operations_comment.py
operations_custom.py
operations_escrow.py
operations_orderbook.py
operations_vote.py
operations_wallet.py
operations_witness.py
```
### Next update
The next update will look to replace Charts.js for a more suitable charting library.
### Known issues
- At the moment if no operation occurred in a specific period, the period does not get added. By default this should be set to 0.
### Roadmap
- Replace Charts.js for a library that is better equipped to deal with large amounts of data points and has a zoom function
- Add analytics for all operation types
- Add user analytics
- Create a daily automated report of important data posted to a STEEM account
- Create an overview with most relevant data as the home page
- Write documentation
#### GitHub Account
[Juless89](https://github.com/juless89)👍 cheneats, yougotresteemed, musiclove, kalasuut, ezravandi, steempytutorials, trailreward, jadabug, hamsa.quality, accelerator, juliank, leir, drorion, szigemanel, tradhornspefring, everfenha, rioplotunook, haley4k, vieletporid, fc542f, samptoterdo, anna0, jasmineacykp, brianna00, anna1lp9, taetaperro, avamqnv2, cutowncomfa, nieloagranca, elviento, ulockblock, amosbastian, rufans, helo, jaff8, asaj, tobias-g, codingdefined, espoem, sketch17, mops2e, portugalcoin, sacred-agent, mcfarhat, properfraction, zuur, tensor, ausbitbank, mytechtrail, greenorange, bachuslib, miniature-tiger, fw206, justyy, utopian.trail, techslut, minersean, erikaflynn, jakipatryk, walnut1, suesa, tykee, silviu93, dakeshi, vishalsingh4997, elear, zoneboy, che-shyr, iqbaladan, mcyusuf, gentleshaid, aussieninja, didic, dssdsds, jayplayco, stem-espanol, kakakk, jk6276.mons, eternalinferno, sargoon, rollthedice, jk6276, mrsbozz, jaxson2011, ajayyy, miguelangel2801, emiliomoron, tomastonyperez, josedelacruz, joseangelvs, viannis, erickyoussif, fran.frey, lorenzor, tsoldovieri, iamphysical, felixrodriguez, azulear, ivymalifred, eliaschess333, elvigia, joelsegovia, amart29, jrevilla, giulyfarci52, rewarding, vanarchist, rehan12, dalz, alexs1320, scienceangel, yu-stem, amestyj, eniolw, geadriana, alex-hm, carlos84, ennyta, endopediatria, anaestrada12, kaczynski, steem-ua, newsrx, eastmael, circa, bejust, feronio, progressing, utopian-io, tombstone, cryptouno, swapsteem, ascorphat, ace108,