18-07-2025 - Mathematical Analysis - Maximums, Minimums, and Saddle Points [EN]-[IT]
hive-146620·@stefano.massari·
4.930 HBD18-07-2025 - Mathematical Analysis - Maximums, Minimums, and Saddle Points [EN]-[IT]
 --- *~~~ La versione in italiano inizia subito dopo la versione in inglese ~~~* --- **ENGLISH** https://images.ecency.com/DQmNuqRpdWgTaWvjwbmaVWSemm13V7viV9jyRyVFHiMSbYA/optimized_image_1_.jpeg **18-07-2025 - Mathematical Analysis - Maximums, Minimums, and Saddle Points [EN]-[IT]** With this post, I would like to provide a brief introduction to the topic in question. (code notes: X-30) ***Maximums, Minimums, and Saddle Points*** 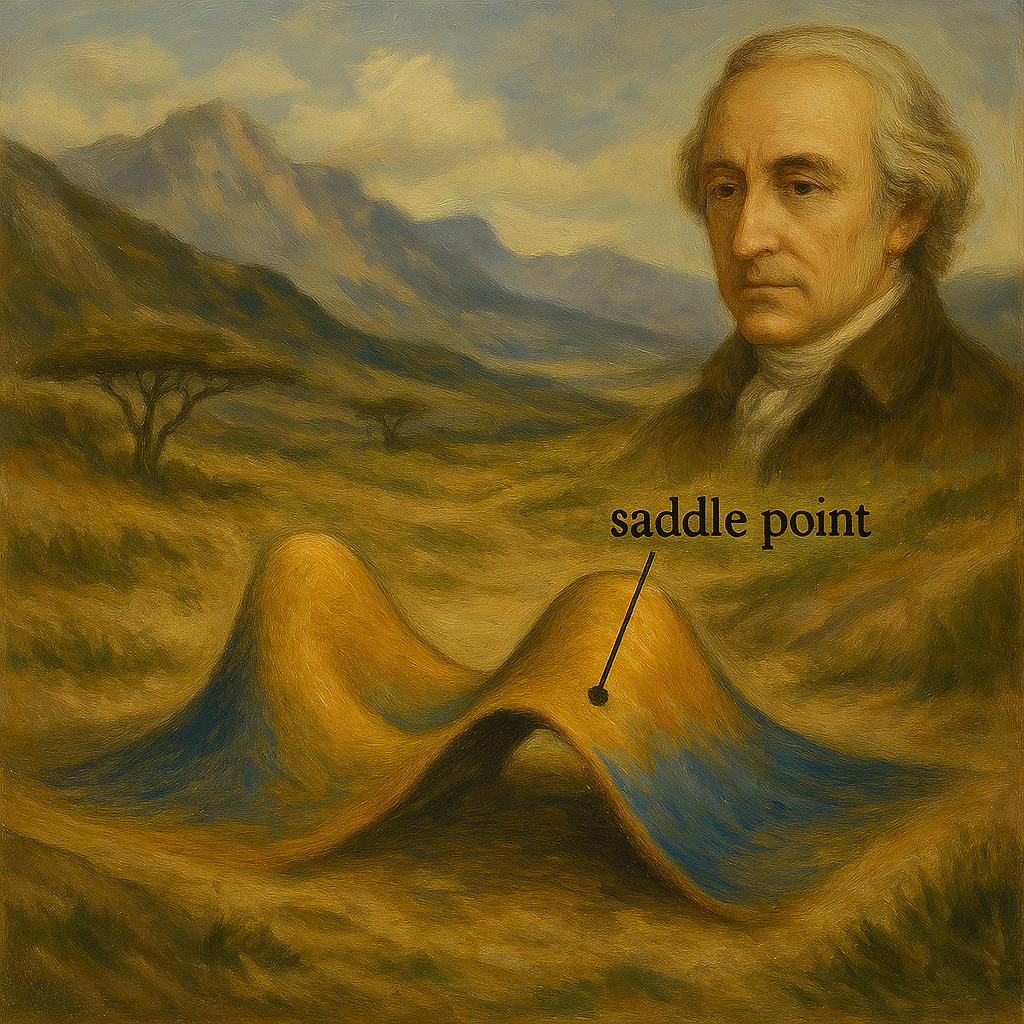 *Image created with artificial intelligence, Microsoft Copilot software used* **Introduction** We can talk about maximums, minimums, and saddle points when dealing with both single-variable and multivariable functions. **Local Maximum and Minimum** A local maximum or minimum is a maximum or minimum point located within a range of values; they are identified in a portion of a function. Let's consider the following function: 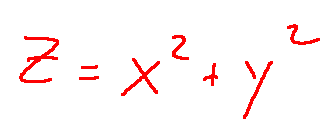 However, let's not study it for all x and y values, but only for certain x and y values. We'll obtain a partial graph that gives an idea of what the function represents, but remember that it's not exactly the graph of the entire function, but rather a portion. In the graph, we'll notice that there's a minimum at point **(0,0,0,)** 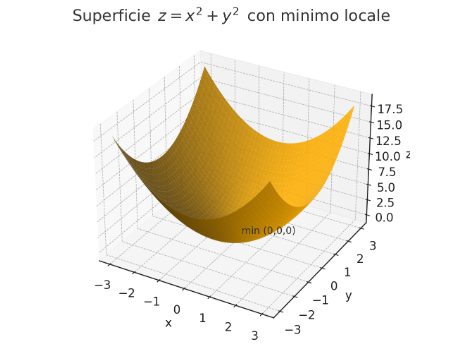 *Image created with artificial intelligence, the software used is ChatGPT* From that point, we can move in any direction and the value of the function will always be greater than the desired local minimum. **Absolute maximum and minimum** The absolute maximum and minimum of a function are the largest or smallest value that the function f can assume over the entire domain. For example, in the Gaussian dome, that is...  ...has its absolute maximum at the point **(0,0,1)**. The value 1 is the peak of the two-variable function expressed above. Below is the graph showing the absolute maximum. 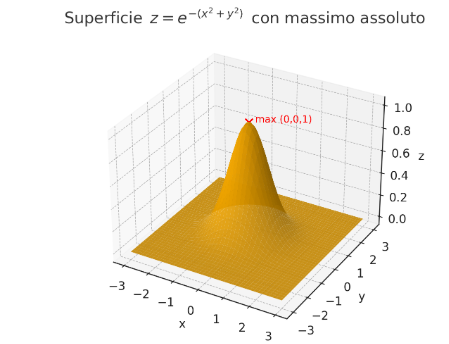 *Image created with artificial intelligence, ChatGPT software used* **Saddle Points** Now we come to the most interesting part of this article: the saddle point. A saddle point is a point where a surface rises in some directions and descends in others. Essentially, it's like being on a mountain, on a pass where, depending on the direction you take, you can go up or down. To better understand the saddle point, we absolutely must consider a function that creates a particular graph where a saddle point exists. For example, let's take the following function:  And here is the graph that generates this function. 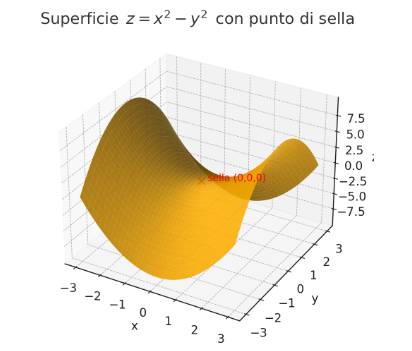 In the graph, we see the saddle point **(0,0,0)** in red. From that point, if we take the direction indicated by the blue arrow, we descend; if we take the direction indicated by the red arrow, we ascend. Below, I reproduce the graph showing the two directions described. first 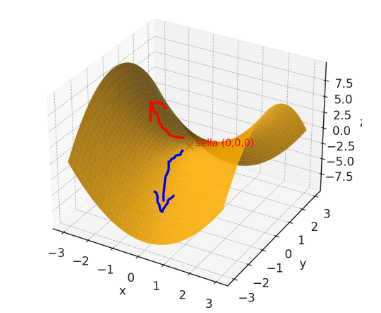 ***Conclusions*** Knowing the maxima, minima, or saddle points of a function helps us understand the optimal solutions to a problem that has been rewritten mathematically. These points are also crucial when designing, because we can size structures and mechanisms with complete awareness. ***Question*** Did you know that it was Joseph-Louis Lagrange (an Italian-born French mathematician and astronomer) who, around 1770, laid the foundations for understanding and studying the saddle points of a function? --- https://images.hive.blog/1536x0/https://files.peakd.com/file/peakd-hive/green77/gGQutTRs-hive-spacer.png --- **ITALIAN** https://images.ecency.com/DQmQ25zcp9Mna5r5gtLp786kVkVUpkVnQwgG7oWuMo88d7P/optimized_image.jpeg **18-07-2025 - Analisi Matematica - Massimi, minimi e selle [EN]-[IT]** Con questo post vorrei dare una breve istruzione a riguardo dell’argomento citato in oggetto (code notes: X-30) ***Massimi, minimi e selle***  *immagine creata con l’intelligenza artificiale, il software usato è Microsoft Copilot* **Introduzione** Possiamo parlare di massimi, minimi e punti di sella quando maneggiamo sia funzioni ad una sola variabile sia una funzione con più variabili. **Massimo e minimo locale** Un massimo o un minimo locale sono dei punti di massimo o di minimo localizzati all'interno di un intervallo di valori, sono individuati in una porzione di funzione. Prendiamo in considerazione la seguente funzione:  Pensiamo però di non studiarla per tutte le x e le y, ma solo per determinati valori di x e di y. Otterremo un grafico parziale che da un'idea di cosa rappresenti la funzione, ma ricordiamo che non è esattamente il grafico di tutta la funzione, ma appunto, una parte. Nel grafico noteremo che c'è un minimo nel punto **(0,0,0,)**  *immagine creata con l’intelligenza artificiale, il software usato è ChatGPT* Da quel punto ci possiamo spostare in qualsiasi direzione che il valore della funzione sarà sempre superiore al volere di minimo locale. **Massimo e minimo assoluti** Il massimo e minimo assoluti di una funzione sono il valore più grande o più piccolo che la funzione f possa assumere su tutto il dominio. Ad esempio nella cupola Gaussiana cioè....  ...ha il massimo assoluto nel punto **(0,0,1)**. Il valore 1 è il picco della funzione a due variabili espressa prima. Qui sotto il grafico dove è segnalato il massimo assoluto  *immagine creata con l’intelligenza artificiale, il software usato è ChatGPT* **Punti di sella** Adesso arriviamo alla parte più interessante di questo articolo, ovvero il punto di sella. Un punto di sella è quel punto in cui una superficie sale in alcune direzioni e scende in altre. Sostanzialmente è come essere in una montagna, su un valico dove a seconda della direzione che si prende si può salire o scendere. Per capire meglio il punto di sella dobbiamo assolutamente prendere in considerazione una funzioni che crei un grafico particolare dove esista proprio un punto di sella. Prendiamo per esempio la seguente funzione  Ed ecco qui di seguito il grafico che genera questa funzione.  Nel grafico notiamo in rosso il punto di sella **(0,0,0)** Da quel punto se prendiamo la direzione indicata dalla freccia blu scendiamo, se invece prendiamo la direzione indicata dalla freccia rossa saliamo Qui di seguito ripropongo il grafico in cui riporto le due direzioni descritte prima  ***Conclusioni*** Conoscere i massimi, i minimi o i punti di sella di una funzione aiuta a comprendere dove sono le soluzioni ottimali di un problema che è stato riscritto in maniera matematica. Questi punti sono inoltre importantissimi quando facciamo progettazione, perché possiamo dimensionare strutture e meccanismi con il massimo della consapevolezza. ***Domanda*** Lo sapevate che fu Joseph-Louis Lagrange (matematico e astronomo italiano naturalizzato francese) che circa nel 1770 pose le basi per comprendere e studiare i punti di sella di una funzione? **THE END**
👍 dexpartacus, pab.ink, healthymary, blumela, hardrockcrypto, pjansen.ctp, garlet, libertypal27, libertypob27, nainaztengra, libertycrypto27, robibasa, spurisna, sportgamer, ilcontabile, sweetunicorn, kappa9, nftfrappe, odb-contest, steveguereschi, cryptomonica, cur8, hivebuzz, clifth, lizanomadsoul, manncpt, jnmarteau, bilpcoinbpc, pinmapple, roelandp, discovereurovelo, fronttowardenemy, princessmewmew, joeyarnoldvn, xsasj, itchyfeetdonica, greddyforce, musicandreview, kimzwarch, gabrielatravels, pensieristupendi, menny.trx, maaasha, skiptvads, vcclothing, k4rl4, grapthar, stea90, lorenzopistolesi, lolz.nxg, stdd.neoxag, bulliontool, ankhive, galberto, steemtelly, quochuy, steemulant, pocketjs, mad-runner, tipu, kryptogames, bcm, dappstats, sabajfa, kam5iz, mukadder, soyernesto, sewzee, cryptogambit, longer, davideownzall, irivers, fedesox, mrdani12, jorgebgt, rosauradels, bntcamelo, bisolamih, peerfinance, arcange, laruche, walterjay, orlandumike, egistar, lee1938, holovision.stem, bodrex27,