Simple bitcoin charting
indonesia·@strange-walker·
0.000 HBDSimple bitcoin charting
Hi there again, guys. A little update here. Bitcoin could not break the merge of 2 resistances (Channeling down and 110 days moving average ) @ $11500. It was corrected around 10% yesterday. If bitcoin is to break up, it needs to go up to at least to $11800 to confirm the bullish case. If it is to go follow the channeling down pattern, the target price is $ 7000. 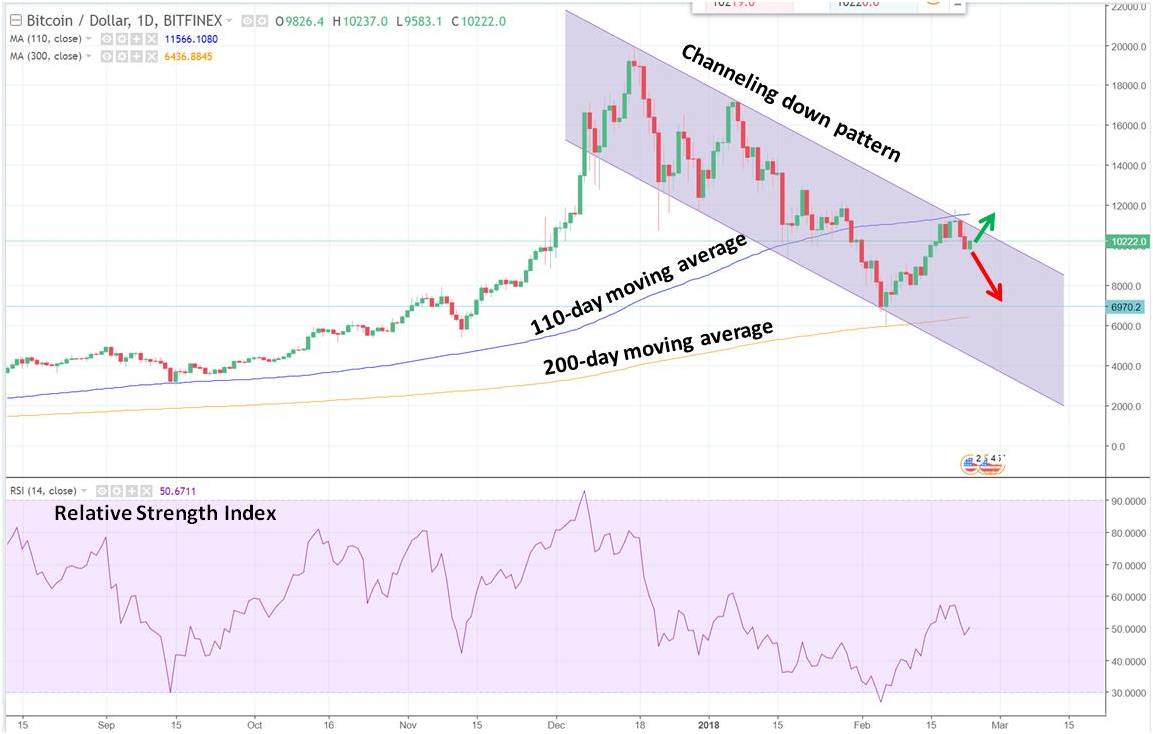 Tell me what you guys think!!