Preliminary Investigation: Finally, the Real Culprits
hive-186392·@thecrazygm·
0.000 HBDPreliminary Investigation: Finally, the Real Culprits
Hey everyone, My investigation into the high CPU usage on the "moon" server has been a process of refining the data to get a clear answer. After first identifying `python3` processes as the general cause, I [updated my metrics script](https://gist.github.com/TheCrazyGM/9c5945224d89152827036b76e84bbbb1) to capture more detailed information, specifically the full command line of the top process. This new data allows for a much more precise analysis. Instead of just guessing which Python scripts are the problem, I can now query the metrics database for exactly which commands are running when the server's total CPU usage spikes. #### The Analysis 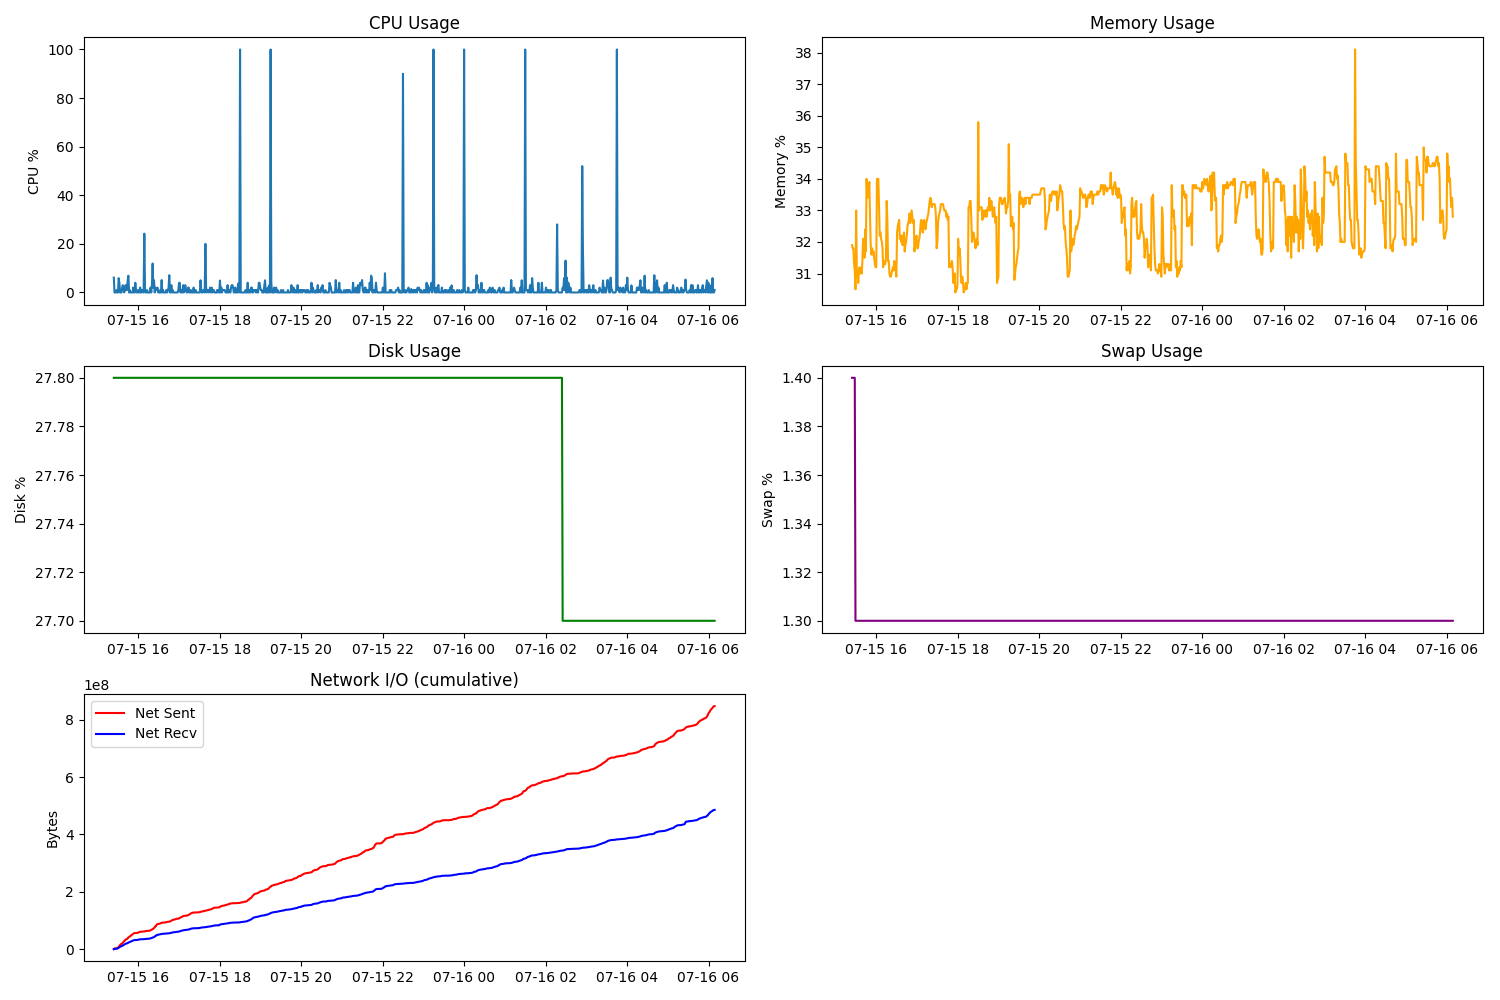 I ran a simple query to select the top CPU command line from any data point where the server's overall CPU usage was greater than 50%: ```bash sqlite3 -header -csv server_metrics.db "SELECT top_cpu_cmdline FROM metrics WHERE cpu_percent == 100" ``` 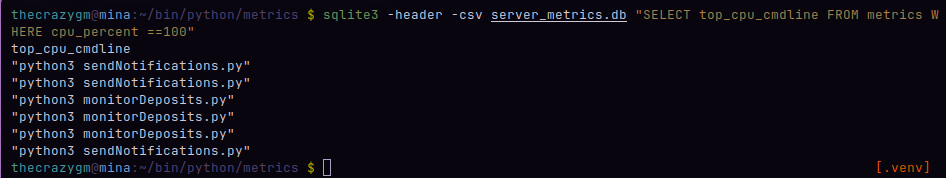 ```bash sqlite3 -header -csv server_metrics.db "SELECT top_cpu_cmdline FROM metrics WHERE cpu_percent > 50" ``` 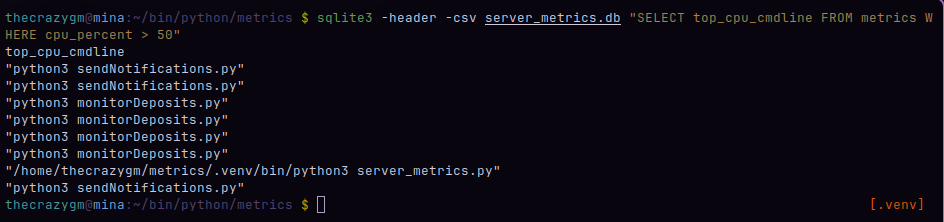 The output was a list of the commands that were at the top of the process list during these high-load moments. After tallying the results from the last 24 hours, two scripts are clearly responsible for the vast majority of the CPU spikes: - `python3 sendNotifications.py` - `python3 monitorDeposits.py` These two background bots appeared with roughly equal frequency during the periods of high load. Interestingly, the metrics collection script itself showed up once, but its impact is negligible compared to the notification and deposit monitoring scripts. #### Conclusion This finally gives us a clear, actionable target. The high server load isn't coming from the web applications, as one might suspect, but from background daemons running constantly. The next step is to dive into the code for `sendNotifications.py` and `monitorDeposits.py`. I'll be looking for any inefficiencies, such as loops that don't have a `sleep` interval, or resource-intensive calculations that can be optimized. This has been a great lesson in the importance of collecting the _right_ data. It took a few tries, but we now have a precise answer. As always, Michael Garcia a.k.a. TheCrazyGM
👍 beco132, freecompliments, hdmed, hetty-rowan, wongi, beststart, poplar-22, georgesantana73, hive-140084, pepetoken, fc-curation, fc-rewards, fc-arbitration, magicalex, indeedly, trovepower, mmbbot, jacor, moretea, ecoinstant, morwhale, coolguy123, guurry123, gurseerat, trashyomen, vrezyy, tub3r0, marynn, chrisly.social, holdeck2, vrezion, whitneyalexx, tengolotodo.leo, timix648, converter.bonus, bankrobbery, d-a-d, pepe.voter, claudiavb, murtaza-7868, digi-alt, michael561, fatman, hive.pizza, tomiscurious, we-are-palcoin, msp-makeaminnow, eturnerx, we-are-one, voter000, cryptoknight12, morwhaleplus, morwhalebonus, jozefkrichards, kernelillo, najat, bilpcoinbpc, emsenn0, onewolfe, fireguardian, adamada, voter003, hivetrending, huzzah, cooperclub, lothbrox, thoth442, funnel, grocko, votehero, ravenmus1c, manclar, dadspardan, h3m4n7, spiritverve, prosocialise, svanbo, jazzhero, dpend.active, sketching, mxm0unite, esmeesmith, fonestreet, casimodo, mk992039, instagram-models, partytime.inleo, lisamgentile1961, ijebest, calebmarvel24, bambukah, steembasicincome, sbi2, sbi3, joeyarnoldvn, anikys3reasure, awesomegames007, tdas0, piestrikesback, buildingpies, sbi-tokens, qwertm, briefmarken, shauner, noloafing, sneakyninja, netzisde, bububoomt, thedailysneak, babysavage, ravensavage, neoxvoter, gamer00, pixelfan, sports.power.bot, chaosmagic23, chaos23, kiemis, youloseagain, hivelist, hive.friends, calmphoenix, rudy-dj, kasih-sayang, russia-btc, rulivyxo, penguinpablo, cryptonized, funnyman, alphacore, hungrybear, artlover, ichheilee, jacuzzi, deepresearch, szukamnemo, techguard, cryptoniusrex, eforucom, mes, lolz.byte, gaottantacinque, cribbio, gasaeightyfive, keys-defender, cryptoshots.nft, crypto-shots, marcocasario, karina.gpt, hive-defender, cryptoshots.play, cryptoshotsdoom, dutchchemist, thgaming, summertooth, zaddyboy, senseisar, kraaaaa, beffeater, wahlterwhite, braaiboy.pgm, dbooster.thg, psyberx, walternate, psx-bank, jim-crypto, mochilub, willkomo, balvinder294, adulruna, steemtelly, steemulant, deggial, likedeeler, pakx, bbarelyseal, gornat, olympicdragon, herman-german, fw206, woelfchen, tydynrain, dstampede, lrekt01, ecoinstats, accelerator, treasure.hoard, ryosai, thecrazygm.bank, bengy, aakom, gmlgang, a-bot, bigmoneyman, archon-gov, irisworld, pof.archon, abrockman, monsterrerentals, everythingsmgirl, voxmortis, ykretz, alonicus, tokenpimp, pimp.token, thepimpdistrict, jaouad2d, athunderstruck, pimptoken, dibblers.dabs, pimpdistrict, thecryptopimp, biglove, blockchainyouth, hivehustlers, thatsweeneyguy, mytechtrail, russellstockley, jglake, maddogmike, thepeakstudio, holoferncro, kam5iz, slothlydoesit, slothburn, slothbuzz, pboulet, shahzaibad, urun,