An Indicator Which Has Predicted Market Crashes Are Starting To Flash Red!
money·@theeconomictruth·
0.000 HBDAn Indicator Which Has Predicted Market Crashes Are Starting To Flash Red!
People always want to know when an event is happening in the markets. I have called for a stock market crash for a while, and we still haven't seen one. It is well overdue as I have gone through videos about the P/E of most global stock markets are in overvalued territory. To give you an insight 13 is in overvalued territory. See the chart below, most of the big exchanges are in overvalued territory. 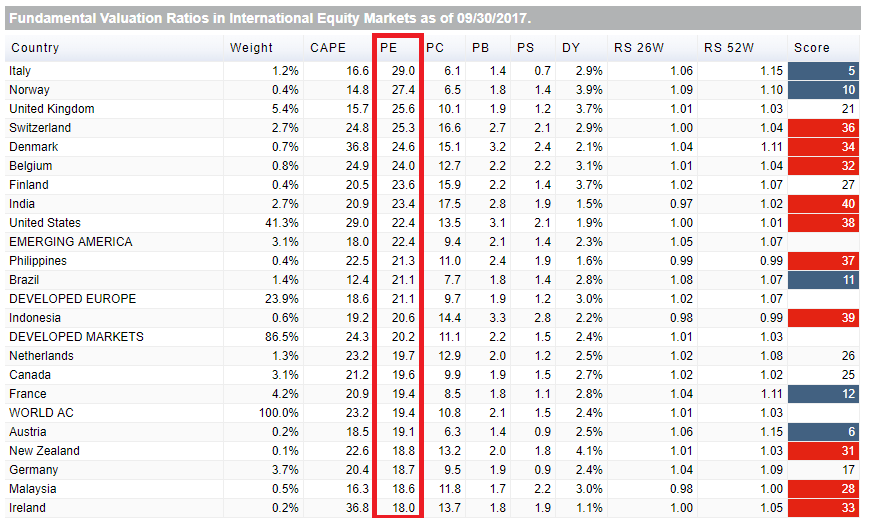 As you can see most big Global markets are overvalued. Now back to the Indicator that is moving to the Red Alert Stock market crash area. The indicator is the yield curve and when it reaches what is called inverted territory, meaning that a 10-year government bond is yielding lower than a 2-year government bond. This indicator as you can see in the chart below predicts every coming stock market crash. So you should pay attention to this chart. 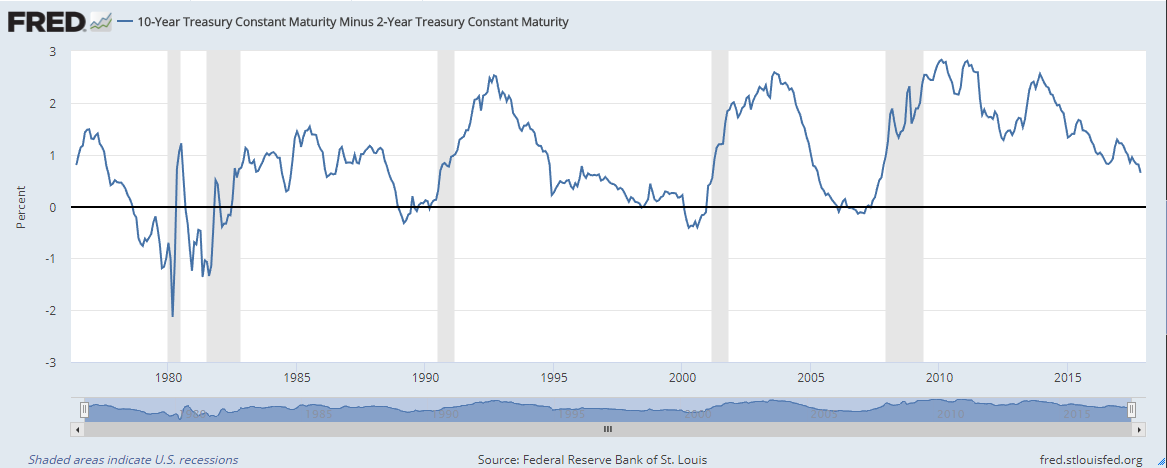 As you can see the so-called yield curve is flattening and may invert in the very near future. The gray areas in the FED's chart are recessions. @marketreport has done a tremendous amount of reporting of what very few has been reporting on in MSM. If you want to look what I found from MSM here is a Bloomberg article: https://www.bloomberg.com/news/articles/2017-12-11/the-yield-curve-is-flatter-remind-me-why-i-care-quicktake-q-a There are plenty of indicators that are flashing red and the PE and Yield curve are some of the most accurate predictors of coming recessions and stock market crashes. You cannot dispute their reputation, but how long can the markets stay in irrational exhuburance? Probably a little more. Seeing an everincreasing use of Margin debt and other debt used to complete share buybacks to hold the bubble afloat. John Sneisen