SPY (S&P) Kinematic Outlook- Th26 Intraday April 2018
stocks·@ufotext·
0.000 HBDSPY (S&P) Kinematic Outlook- Th26 Intraday April 2018
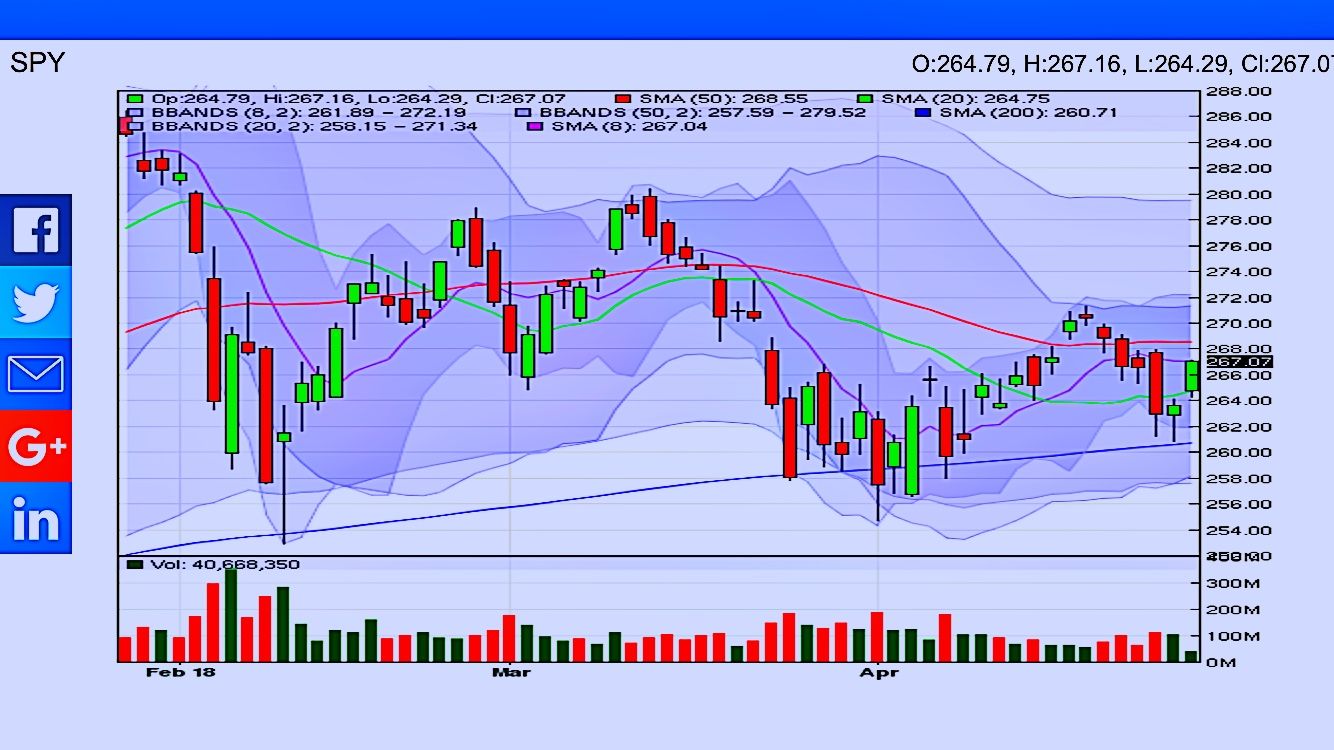 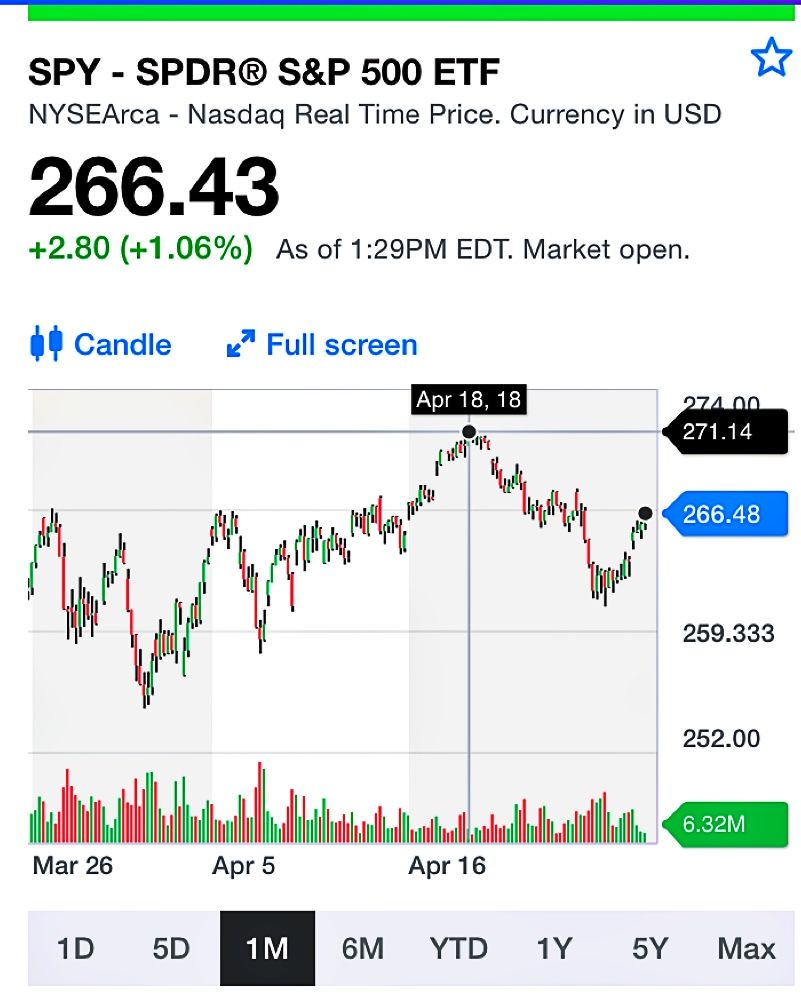 Graphs= SPY Th26 Intraday Post Time= 2:06PM Th26 UFOtext= Kinematic Outlook 📈SPY=266.45 (+2.82) Th26 Intraday. Closing price (+Th26 Intraday) in 2 day uptrend from exact Tu24 low. *Kinematic snapshots* show premature early stage peaking from potential ~Tu24 k lows. *(Snapshots = Real time approximate kinematics) x dma: 5: 1 day k uptrend from TuWed25 cluster low might start forming high. 8: 1 day exact k uptrend (in loose TuWedTh26 cluster) ready to start forming high. 13: 2 day k uptrend starts forming high. 21: 1 day k uptrend from uptrend cluster pause looks to go higher. 34: 1 day k uptrend from TuWed25 cluster low ready to start forming high. 🌳-Linear- Future Possibility Tree (Linear test paths in closing price explore exact kinematic patterns 4-5 trading days into the future.) +2.0/day Positive Test Branch: Shows kinematic advance to at least Wed2. x dma: 5: Advance to upper range WedThFr4 kinematic cluster peak. 8: Free rise from TuWedThFr27 cluster low to beyond upper range. 13: Advance from kinematic uptrend cluster pause now to upper range WedThFr4 cluster peak. 21: Advance to upper range Wed2 k peak. 34: Free rise from TuWedThFr27 cluster low to above zero line. Zero/day Test Branch: Shows mixed kinematic behavior. Look to positive & negative branches for clarity. x dma: 5: K uptrend to TuWed2 minor peak. 8: K downtrend pause now toward exact Mon30 significant low below zero at prior low. 13: Sharp Th26 high from sharp Tu24 low on zero line support making sharp downtrend zig zag into kinematic free fall. 21: Advance to significant Tu1 k peak. 34: Downtrend cluster pause now leads to Mon30 k low. -2.0/day Negative Test Branch: Shows kinematic free falls from ThFr27 k peaks. x dma: 5: Free fall from Fr27 k peak < zero. 8: Free fall to Th3. 13: Free fall from minor k peak today Th26. 21: Free fall from minor k cluster peak on Th26Fr27. 34: Free fall to deeper territory. -2.5/day Linear Crash Threshold Branch: Shows free fall from today's close across the dma spectrum. Very low threshold shows very weak kinematic support. 🌳-Linear- Tree Summary= Positive branch shows major rally to at least Wed2. Negative branch almost shows free fall collapse. Note the precise clarity of the 13 dma kinematic zig zag lower into free fall. 🌳~Nonlinear~ Future Possibility Tree ☑️ Looking for a major rally to at least ~Wed2 or an imminent free fall collapse in future closing price- or else trivial meandering around the flat line...